

Updated November 14, 2026. Market data: November 13, 2026 regular-session close, 4:00 p.m. ET. Prices in U.S. dollars.
Western Digital makes the hard disk drives that store data for cloud providers, data centers, businesses, and consumers. After separating its flash business into Sandisk in 2025, WDC became focused on HDD storage. Seagate is its closest listed competitor. WDC benefits from the infrastructure behind AI, but buying storage capacity is a different business from buying AI chips. Company filing.
WDC stock buy zones now deserve attention—but a 63% correction does not make this an automatic bargain. My assessment: a small starter can be justified near $296, while larger purchases need either a better price or stronger confirmation. Staggered purchases. No all-ins.
1. WDC stock: the current snapshot
| Measure | Reading |
|---|---|
| Regular-session close | $295.65; −5.00% on November 13 |
| After-hours | $290.85 at 7:59 p.m. ET; lower-liquidity session |
| 52-week high / low | $799.87 / $132.43 |
| Correction from high | −63.04% |
| Market assessment | Mixed/rotational; defensive toward AI hardware |
Calculation: ($295.65 − $799.87) ÷ $799.87 × 100 = −63.04%. The high is a reference point, not a fair-value target. Sources: quote and independent quote/history.
2. Six WDC stock buy zones—and why they exist
These are conditional capital-allocation ranges, not mechanical orders. At shared boundaries, I use the more cautious zone. Every buying label requires the business thesis to remain intact.
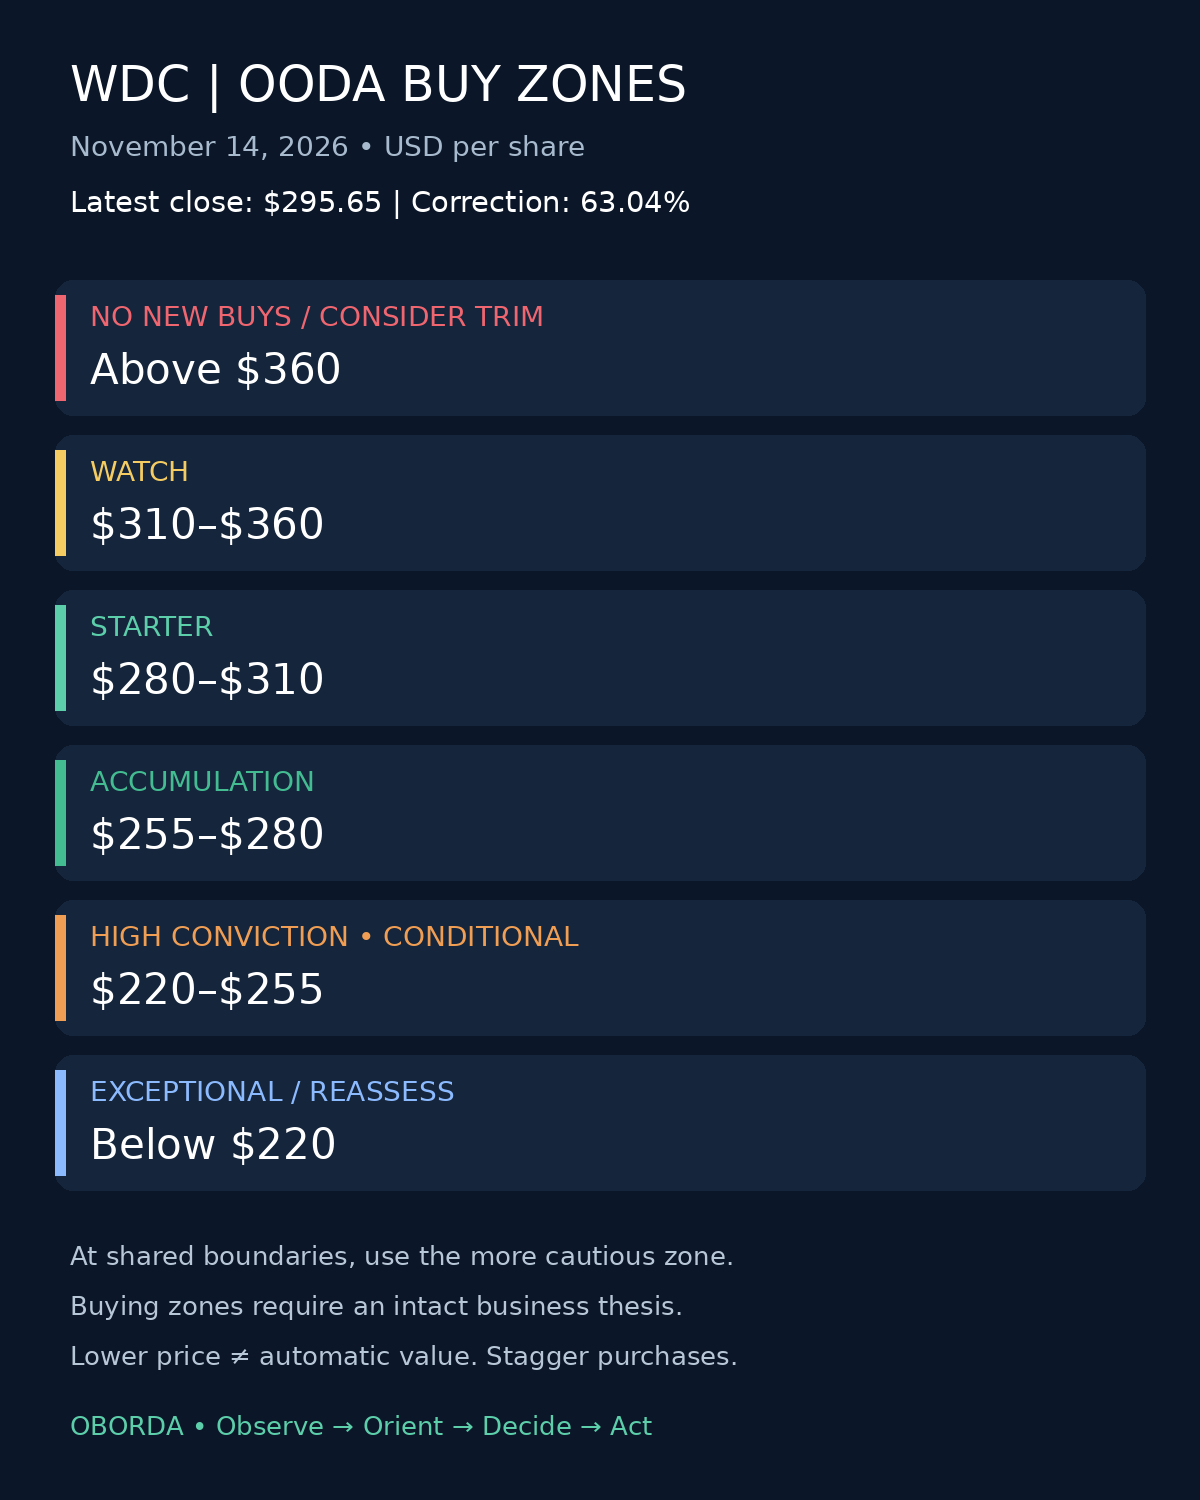
| Zone | Price | Evidence and interpretation |
|---|---|---|
| 🔴 No New Buys / Consider Trim | Above $360 | Above roughly 16.4× my $22 EPS assumption; substantial overhead supply with the 50-day average near $392. Further earnings upgrades could justify revisiting this ceiling. |
| 🟡 Watch | $310–$360 | Recent $311–$319 resistance, the $336 short-term average, and former $340–$360 trading support limit immediate upside. |
| 🟢 Starter | $280–$310 | Encompasses recent $286–$295 trading; approximately 12.7–14.1× assumed EPS. Limited exposure is reasonable while the bottom remains unconfirmed. |
| 🟢🟢 Accumulation | $255–$280 | Includes the $258.61 November low and subsequent $270–$276 levels; approximately 11.6–12.7× assumed EPS. Add only if support and the business hold. |
| 🔥 High Conviction—conditional | $220–$255 | Approximately 10–11.6× assumed EPS. This is a valuation-led margin of safety; recent technical support below $258 is unverified. Require fresh evidence before buying. |
| ⚡ Exceptional / Reassess | Below $220 | Below 10× assumed EPS, but a lower price could be signaling falling earnings. Investigate before acting. |
The lower zones are less technically substantiated than the starter and accumulation ranges. Their labels describe conditional valuation appeal, not certainty about a floor. Technical anchors: daily history and daily indicators.
3. Stronger business results, weaker share price
Fiscal Q1 2027 revenue reached $4.381 billion, up 55% year over year; adjusted EPS rose 161% to $4.64. Adjusted gross and operating margins were 58.1% and 49.1%. Operating cash flow was $1.604 billion, free cash flow $1.38 billion, capital spending $227 million, and repurchases about $1 billion.
For Q2, management projects $5.0–$5.2 billion revenue, $5.60–$6.00 adjusted EPS, and 60%–61% gross margin. Cash stood at $1.314 billion; current debt was $789 million. Inventory increased from $1.511 billion to $1.781 billion. Official earnings release and financial statements.
My interpretation: the business is strengthening. Qualification requirements, manufacturing expertise, and high-capacity technology support its competitive position. Hardware sales, however, do not offer subscription-style recurring revenue. Today’s pricing power must be tested through the next storage cycle.
WDC fell 2.97% in the session after earnings. Strong results followed by selling suggest that current performance alone has not resolved expectations about future demand and profitability. This is an interpretation of price reaction, not proof of investor motives.
4. Cheap earnings—or peak earnings?
Reported forward P/E is approximately 10.2×, versus 11.2× for Seagate. WDC’s trailing free-cash-flow yield is roughly 3.9%, so the cash-flow case is less obviously cheap than the earnings multiple suggests. Sources: WDC statistics and Seagate comparison.
Historical multiples require caution because the Sandisk separation changed the business mix. WDC’s reported forward P/E was approximately 34× at fiscal 2026 year-end and 11× at fiscal 2025 year-end. Neither establishes a permanent fair-value multiple. Historical ratios.
My zone model uses $22 in annual adjusted EPS, slightly below the $23.20 obtained by multiplying the next-quarter guidance midpoint by four. This is an analyst assumption for this article, not company annual guidance, and one strong quarter does not establish a sustainable annual earnings rate.
| 12–18-month scenario | Assumptions | Implied price | Return from $295.65 |
|---|---|---|---|
| Bear | $16 EPS × 12 P/E | $192 | −35.1% |
| Base | $22 EPS × 16 P/E | $352 | +19.1% |
| Bull | $28 EPS × 18 P/E | $504 | +70.5% |
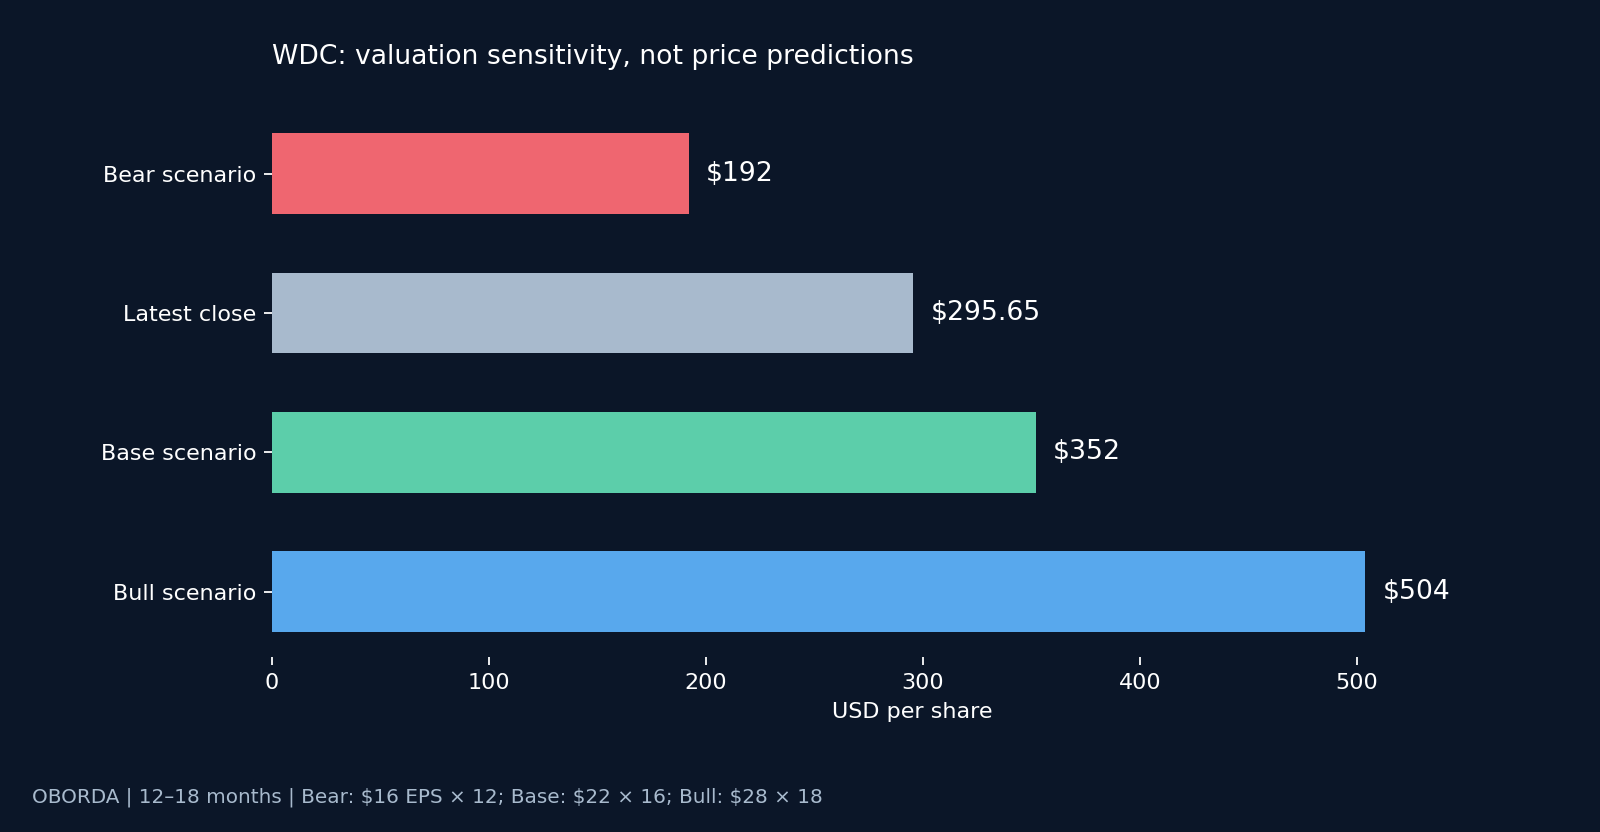
I use 16× for the base case to represent durable but cyclical earnings, 12× for deteriorating confidence, and 18× only if growth persists and the market rewards it. These are judgment-based assumptions, not measured historical valuation percentiles. The roughly 19% base upside versus 35% bear downside does not justify aggressive buying. Near $260, the same cases improve to approximately +35% and −26%.
5. The chart still demands patience
Daily indicators show a 20-day average near $336, a 50-day near $392, and a 200-day near $422. RSI is approximately 38.5; average true range is roughly $27. Price is below all three averages, with the 50-day below the 200-day. Daily technical readings.
The November low was $258.61. A rebound reached a $319 intraday high on November 11 before retreating. November 5 selling volume was roughly 18.35 million shares versus about 4.8 million on November 13. The recent bounce has not formed a durable base. The stock’s longer-term gains coexist with severe recent relative weakness; a formal benchmark-adjusted relative-strength series was not independently calculated. Price and volume history.
- First test: hold the $280–$286 area.
- Initial repair: reclaim $310–$319, then hold above roughly $336.
- Major repair: regain the $392–$422 moving-average region.
- Reassessment trigger: a sustained break beneath $255–$259.
Recent failed rebounds and downward opening gaps support caution. I have not validated a complete inventory of unfilled gaps or older breakout levels below the current base.
6. Market conditions, seasonality, and flows
The S&P 500 fell about 0.4% and Nasdaq about 0.9% on Friday, although both finished the week higher. Technology also advanced over the week. That supports a mixed/rotational classification, with additional pressure on AI hardware. WDC’s much larger drawdown points to storage-cycle and valuation concerns beyond the broad market. Market close; sector review.
The Fed held its target at 3.75%–4.00% in October. The 10-year Treasury yield ended the week around 5.15%, and reported producer inflation reached 6.5% year over year. Higher yields raise my hurdle for deploying new money. Fed statement; weekly rates; inflation and market report.
November seasonality cannot repair a downtrend. Year-end repositioning or tax-related selling are possible influences, not verified explanations for WDC. Reported short interest is approximately 5.2% of float, with the share count slightly lower than the previous month. These delayed figures do not establish shorts as the cause of the decline. Ownership and short-interest data.
7. Catalysts, risks, and what changes my mind
Potential catalysts include sustained cloud demand, higher-capacity drives, improved product economics, and capital returns. WDC previously outlined 40TB UltraSMR volume production for the second half of 2026 and a HAMR ramp in 2027. These are announced plans; completion of every milestone has not been independently confirmed here. Official technology roadmap.
Current growth and margin expansion are already visible. The additional upside catalyst would be evidence that this profitability can endure. Risks include peak-cycle earnings, cloud customer concentration, weaker capital spending, pricing pressure, qualification delays, competition, manufacturing execution, trade restrictions, and supply-chain disruption.
I would reassess after a material guidance cut, persistent inventory growth ahead of demand, weaker cash conversion, deteriorating pricing or margins, or a delayed technology transition. A support break triggers investigation; it does not by itself prove fundamental failure.
Confidence: moderate in the fundamental opportunity; low in calling a bottom. Customer-level bookings and backlog, independently reconciled ROIC, older support below the current base, current insider transactions, ETF flows, and options positioning remain unverified. Conflicting retrieved volatility readings are excluded. These gaps reduce confidence in timing and the deepest buying zones. This is a sourced assessment with disclosed limitations, not a fully audited valuation.
My OODA decision
Observe: business results are strong while the stock is down about 63% from its high.
Orient: the question is earnings durability. The old high does not establish value.
Decide: near $295.65, a small conditional starter is defensible. I prefer $255–$280 for meaningful additions, subject to fresh evidence.
Act: stagger purchases, preserve cash, and require stabilization before increasing exposure. For an existing holding, review concentration and the thesis; a rebound into $336–$360 can be a trim-review opportunity if risk/reward remains unattractive. Stronger fundamentals could justify holding through that range.
Current action: small starter at most. No aggressive accumulation yet.
Cash is a position. Don’t buy the dip. Buy the discount.
Sources and methodology
Linked sources above distinguish company disclosures, market data, and OBORDA interpretation. Market data were checked November 14, 2026 using the latest completed session. Ratios can differ by provider because of forecast periods, adjustments, and update timing. No personal holding or transaction is implied by this article.
Educational analysis, not personalized investment advice. Scenario outcomes and buying ranges are estimates, not guarantees. Reassess after material news or earnings changes.