

NVDA | OBORDA / OODA Investment Engine | November 19, 2026
Why I require a larger margin of safety: I am lowering the buying ranges because leadership succession, unresolved compliance questions, a lower margin outlook, and larger financing commitments increase uncertainty. Possible adverse developments warrant a larger discount. This is a risk-management judgment, not a finding that allegations are true or that NVIDIA’s product demand has collapsed.
NVIDIA’s latest quarter was strong. The investment now requires two separate assessments: what the business is earning, and how much risk attaches to those earnings. This reassessment updates the November 11 buying plan using the newly released results and subsequent official statements.
Sources: NVIDIA Q3 FY2027 earnings release, November 17; NVIDIA: CEO transition announced November 12; DOJ and Commerce: official Megaspeed investigation statement.
What NVIDIA does—and why it matters
NVIDIA designs processors and computing systems that handle many calculations at once. Its graphics processing units, or GPUs, began in graphics and gaming. They now help train AI models and run them after deployment, a process called inference.
Founded in 1993 by Jensen Huang, Chris Malachowsky, and Curtis Priem, NVIDIA went public in 1999. Its software ecosystem, including CUDA, and its networking and full-system designs help customers use its hardware. That ecosystem is an important competitive advantage; it does not eliminate competition or guarantee future pricing.
Sources: NVIDIA corporate history; NVIDIA investor FAQs: IPO history.
Large cloud providers are both customers and potential competitors through their own chip programs. NVIDIA’s latest materials describe expanding deployments with AWS, Microsoft, Google, Oracle, and other infrastructure providers. Its AWS deployment plans are future capacity commitments, not all revenue already earned. The proposed Hugging Face acquisition adds another integration and regulatory consideration.
Sources: NVIDIA: AWS deployment plans and infrastructure collaboration; NVIDIA: agreement to acquire Hugging Face, September 3.
NVDA price snapshot: an early rebound in a damaged trend
Research date: November 19, 2026, America/New_York. Reference: $154.58 at 10:15 a.m. ET during regular trading. Completed-session technicals use November 18. This article preserves that timestamp; it is not a live price feed.
| Measure | Snapshot |
|---|---|
| Regular-session reference | $154.58; November 19, 10:15 a.m. ET; +2.40% versus prior close |
| Last completed close | $150.96; November 18, 4:00 p.m. ET; −2.89% |
| 52-week high / low | $243.37 / $148.80 |
| Correction at reference | −36.48% |
| Correction at last close | −37.97% |
| Market / sector | Mixed/rotational; morning semiconductor rebound |
| Action at the reference price | Watch; no automatic addition |
Correction: ($154.58 − $243.37) ÷ $243.37 × 100 = −36.48%. The previous high is a reference, not proof of fair value.
Sources: Stock Analysis: timestamped NVDA quote and daily price history; Stock Analysis: NVDA overview and 52-week range.
Separate verified facts, allegations, responses, and unknowns
| Status | What the evidence supports |
|---|---|
| Verified corporate action | The SEC filing says the board accepted Jensen Huang’s resignation on November 11. NVIDIA announced the transition November 12. Colette Kress became interim CEO while remaining CFO; a permanent-CEO search began. |
| Verified government action | DOJ and Commerce confirmed an investigation into Megaspeed. Their statement says NVIDIA placed Megaspeed on its no-sell list in June 2025. |
| Allegations, not established findings here | Claims involving chip diversion and foreign-intelligence activity remain unresolved in the reviewed documents. An investigation is not a conviction. |
| Company responses | NVIDIA’s November 8 board statement said it had no reason to believe company secrets or national security were compromised. That was a dated statement, not the final investigation report. Megaspeed denied wrongdoing and announced an outside-counsel review. |
| Unknown | The independent inquiry’s conclusions, the eventual CEO appointment, any quantified liability, and the commercial consequences remain uncertain. |
Sources: SEC: resignation accepted November 11; Form 8-K dated November 12; NVIDIA: CEO transition announced November 12; DOJ and Commerce: official Megaspeed investigation statement; NVIDIA Board statement, November 8; NVIDIA independent directors: outside counsel, November 10; Associated Press: Megaspeed response and unresolved claims, November 15.
The government statement concerns Megaspeed; it does not itself charge NVIDIA or establish the espionage claims. That is a description of this document, not a guarantee that no other inquiry exists. My financial concern is compliance, access to customers and markets, management continuity, and potential costs—not speculation about private lives.
Fresh reporting: financing pledges are not funded purchases
Reported news, not independently verified cash movements: The Wall Street Journal reported November 19 that the widely publicized $500 billion financing initiative had not yet deployed capital. NVIDIA’s earlier SEC filing describes preliminary arrangements that might not become definitive agreements. This is a financing-execution risk; it is not evidence that all customer demand disappeared or that $500 billion was NVIDIA cash.
Sources: Wall Street Journal: financing pledges and deployment report, November 19; SEC: Q2 FY2027 10-Q, preliminary financing arrangements.
Press reports also describe approaches to potential CEO candidates, including Arm’s Rene Haas. An approach is not an appointment. Plaintiffs’ lawyers are soliciting participation in securities litigation; their allegations are not court findings. Final outcomes and quantified exposure were not verified.
Sources: The Guardian, citing Bloomberg: reported CEO approaches, November 19; Rosen Law: plaintiffs’ securities allegations; attorney advertising.
Reported regulatory inquiry: The Wall Street Journal reported a civil SEC investigation into NVIDIA’s investor disclosures. Reuters said the SEC declined comment and NVIDIA had not immediately answered its request. I have not verified a public SEC charge or final finding establishing those allegations.
Sources: Wall Street Journal: reported SEC civil inquiry, November 17; Reuters: inquiry report and requests for comment, November 17.
Verified oversight request: a November 18 House Energy and Commerce letter asks Colette Kress for a briefing by December 2 on export-compliance safeguards and related allegations. This is a disclosure checkpoint, not a scheduled public hearing or a finding of wrongdoing.
Sources: House Energy and Commerce: November 18 briefing request to Colette Kress.
Latest earnings: exceptional growth, with a less comfortable outlook
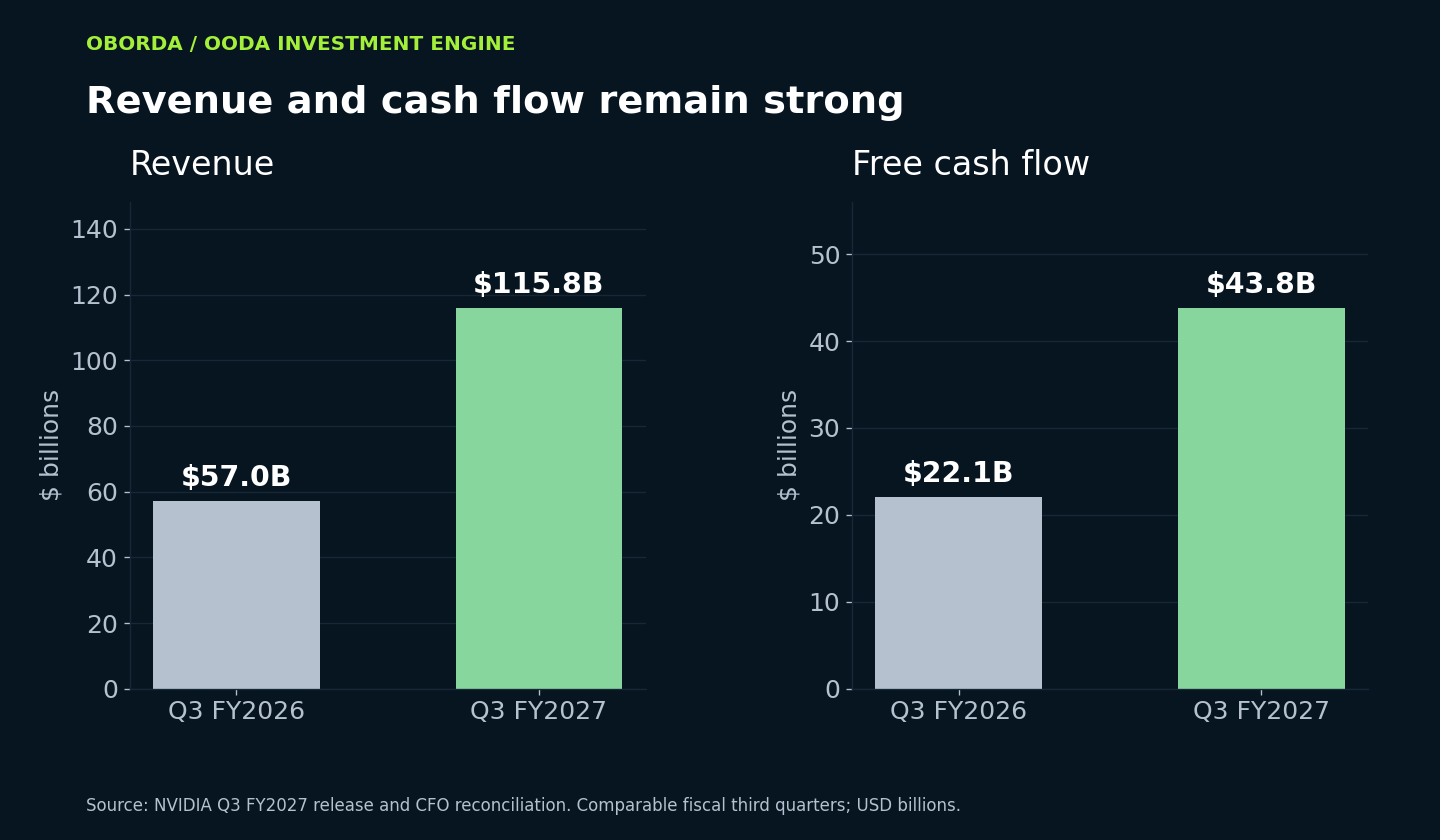
NVIDIA released Q3 FY2027 results on November 17 for the quarter ended October 25. These replace Q2 as the latest reported results.
| Measure | Result |
|---|---|
| Revenue | $115.8 billion; +103% year over year and +20% sequentially |
| Data Center revenue | $107.6 billion; +110% year over year |
| GAAP / adjusted gross margin | 74.8% / 74.9% |
| GAAP / adjusted diluted EPS | $2.70 / $2.68 |
| Operating cash flow | $48.253 billion |
| Free cash flow | $43.777 billion |
EPS means earnings per share. Gross margin is the share of revenue left after direct product costs. Free cash flow is cash from operations after the capital purchases and related principal payments in NVIDIA’s definition.
NVIDIA’s adjusted financial measures now include stock compensation; historical comparisons were restated on that basis. Adjusted earnings still differ from standard GAAP accounting, including their treatment of investment gains.
Sources: NVIDIA Q3 FY2027 earnings release, November 17; SEC: Q3 FY2027 CFO commentary and reconciliation.
| Measure | Outlook |
|---|---|
| Revenue | $130 billion, plus or minus 3% |
| GAAP and adjusted gross margin | 71%–72% |
| GAAP / adjusted operating expenses | About $11.0 billion / $10.7 billion |
| FY2027 tax rate | 16%–18%, excluding discrete items |
| China assumption | No Data Center compute revenue assumed |
| Calendar | Q4 includes an additional week |
The revenue midpoint is about 12% above Q3. The adjusted margin midpoint, 71.5%, is 3.4 percentage points below Q3’s 74.9%. More sales do not necessarily produce proportionate profit growth when each sales dollar carries less margin.
Management attributed Q3’s small sequential margin decline to the initial Rubin ramp. The larger Q4 reduction is confirmed guidance; I will not assume it is entirely temporary without more evidence.
Sources: SEC: Q3 FY2027 CFO commentary and reconciliation.
Original approximation, not company EPS guidance: using $130 billion revenue, 71.5% margin, $10.7 billion adjusted operating expense, 17% tax, and 24.2 billion diluted shares gives about $2.82 EPS before net other income. Annualizing that quarter gives roughly $11.28. The additional week and changing product mix limit this shortcut.
Reported operating demand is strengthening. The risk profile has also become more complicated. Both can be true at the same time. The software ecosystem and integrated systems support pricing power, while customer-designed chips and competing accelerators constrain it. Hardware sales should not be valued as if all revenue were a recurring software subscription.
Cash, collection, and commitments deserve as much attention as sales
The supplementary balance sheet reports $53.512 billion of cash and marketable debt securities, plus a separate $44.219 billion of marketable equity investments. Debt was $32.371 billion, giving about $21.141 billion of net cash before lease adjustments and excluding those equities. Shareholdings are not equivalent to cash in the bank.
Three direct customers represented 14%, 11%, and 11% of quarterly revenue. Two customers represented 18% and 17% of receivables. This concentration makes the financial health and buying decisions of a small group especially important.
Sources: SEC: supplemental financial information, October 25 quarter.
Receivables reached about $81 billion; collection time rose to 64 days from 60. Inventory rose to $39.7 billion from $31.6 billion. Management cited the Rubin ramp and extended terms for certain investment-grade customers. That explanation is plausible, but cash collection still needs to catch up.
Sources: SEC: Q3 FY2027 CFO commentary and reconciliation.
| Category | Reported amount | Interpretation |
|---|---|---|
| Supply and capacity commitments | $390 billion, versus $279 billion last quarter | Future procurement; not customer backlog. |
| Total future commitments table | $518 billion | Includes supply, cloud services, uncommenced leases, investments, and capital spending across multiple years. |
| Additional neocloud agreements | $32 billion maximum | Conditional on financing, deployment, operation, and acceptance. |
| Maximum gross guarantees | $118 billion | Potential support if partners default; timing and conditions matter. |
These categories are not one current debt balance. I have not summed them into a single liability. Full timing, overlap, and enforceability need continued review. The significance is that NVIDIA’s future cash needs increasingly depend on the wider AI financing ecosystem.
Sources: SEC: Q3 FY2027 CFO commentary and reconciliation.
The earnings exhibits are unaudited and furnished with the November 17 Form 8-K. NVIDIA said the 10-Q would follow in coming weeks; I did not verify a filed Q3 10-Q for this assessment. That limits confidence in a fully reconciled view of commitments and legal disclosures.
Sources: SEC: November 17 earnings Form 8-K and exhibits.
Technical structure: oversold is not the same as repaired
| Measure | Reading |
|---|---|
| 20-day simple moving average | $189.04; independently recalculated |
| 50-day simple moving average | $210.30; independently recalculated |
| 200-day simple moving average | $203.72; vendor-reported, cross-checked |
| 14-day RSI | 21.10; deeply oversold, vendor-reported |
| MACD | Below its signal line and zero; bearish momentum |
| 20-session average volume | About 250.1 million shares |
| November 18 volume | 349.8 million; about 1.4× that average |
A moving average smooths prices. RSI gauges momentum; a low reading can precede a bounce while the decline continues. MACD is another trend-and-momentum indicator. The source’s daily readings remain bearish.
Sources: Barchart via Raymond James: completed-session technicals; Wall Street Numbers: dated RSI and moving-average history.
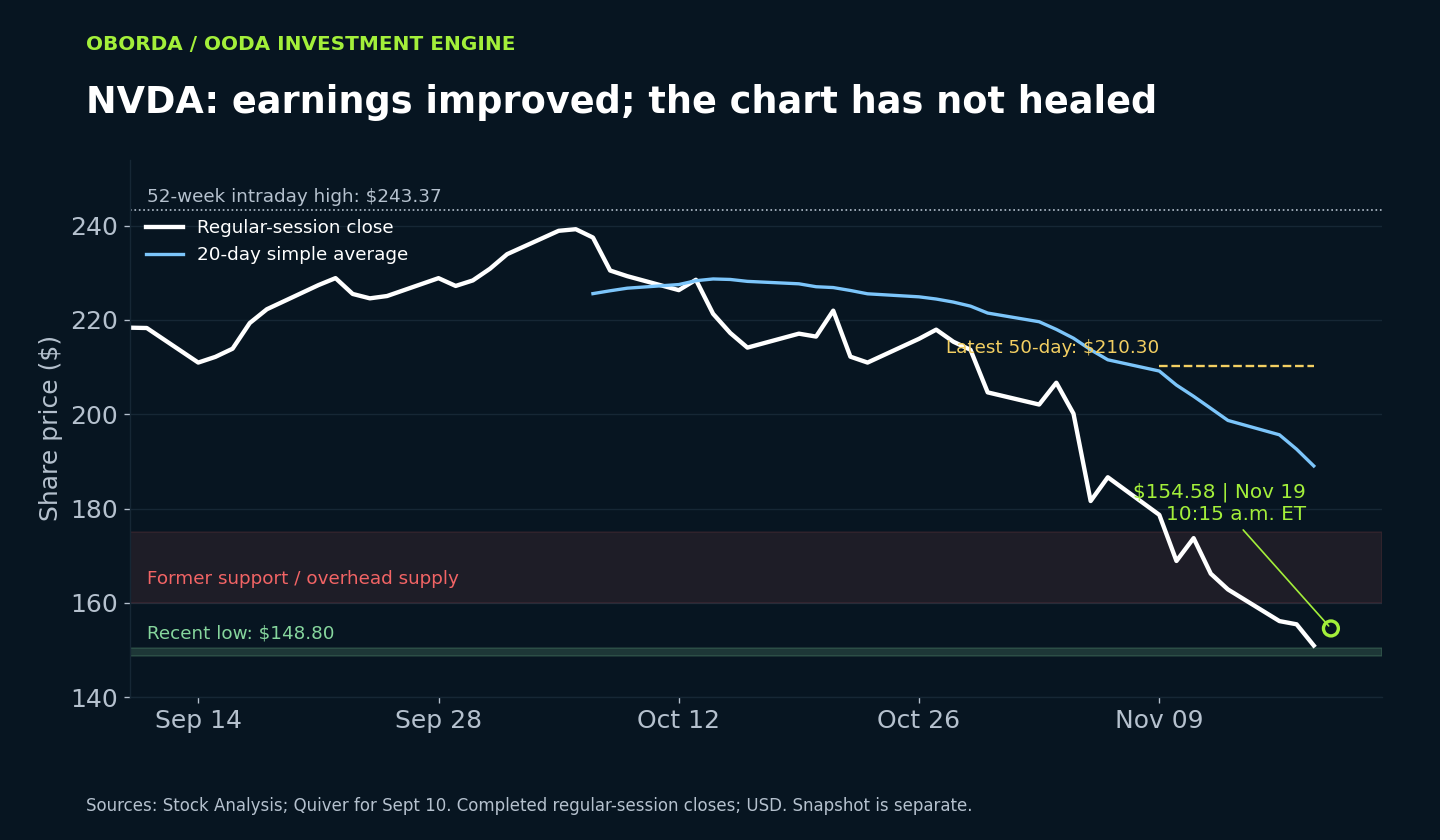
Support is near $148.80–$150.40. Resistance begins around $158–$163, then $166–$175. The November 12 gap down and failed recovery near $170 add overhead supply. The $189–$210 moving-average area is a larger recovery hurdle.
The old $164–$166 support broke. That is direct evidence against carrying the earlier starter range forward unchanged. A higher low near $150 and a sustained reclaim of $160–$163 would improve the setup. Neither is established by an early rebound alone.
Sources: Stock Analysis: timestamped NVDA quote and daily price history.
Source reconciliation: an earlier quote-service intraday 50-day average was around $209.05. Using the updated $154.58 observation and dropping September 10 reproduces approximately $209.028. Using 50 completed sessions gives $210.3032. This assessment consistently uses the completed-session number.
Sector, market, outages, and flows
On November 18, NVDA fell 2.89%, while SOXX gained 0.28% and SMH slipped 0.12%. That relative weakness followed the earnings release. On November 19, SMH was up 3.83% at 10:02 a.m. and SOXX was up 4.43% at 10:04 a.m., versus NVDA’s 2.40% gain at 10:15 a.m. These are separate timestamped observations, not synchronized prices.
Sources: Stock Analysis: SOXX daily and intraday comparison; Stock Analysis: SMH daily and intraday comparison.
That pattern supports a company-specific risk premium alongside broad AI-market volatility. It cannot establish exactly how much selling came from governance concerns, profit-taking, rates, or financing worries.
The prior close showed an S&P 500 five-session losing streak, with the index down about 3.1% for the week and Nasdaq down 2.8%. November 19 premarket futures indicated a relief rally. My market classification remains mixed/rotational with elevated risk; a semiconductor rebound does not by itself repair the broader setup.
Sources: Associated Press: November 18 market close; eOption: November 19 premarket context, not live index quotes.
The latest Fed target was 3.75%–4.00%. The 10-year Treasury yield was about 5.07% on November 18. October headline and core CPI increased 0.4% and 0.3% month over month; VIX closed around 24.56. Higher yields and uncertainty can reduce the valuation premium paid for distant growth.
Sources: Federal Reserve: October 28 policy statement; U.S. Treasury: November 18 interest-rate snapshot; BLS: October 2026 Consumer Price Index; WiseView: November 18 VIX snapshot.
Recent U.S. outages are not a verified NVIDIA product failure or a measurable NVIDIA revenue catalyst in the evidence reviewed. The FAA described a technical network problem and no indication of a cyberattack; Microsoft attributed its disruption to a technical update. Infrastructure reliability, cyberattacks, and export-control allegations require different evidence.
Sources: FAA: ground-stop investigation and technical findings; ABC News: recent outage causes and company responses.
October 30 short interest was about 279.6 million shares, 1.21% of float, down 7.3% from the prior settlement. It predates the November controversy, so it cannot explain current positioning. Current institutional selling, options-dealer exposure, and net ETF flows were not independently verified.
Sources: MarketBeat: October 30 short-interest settlement.
NVIDIA repurchased about $22.1 billion of shares in Q3. Remaining authorization was $227.3 billion; authorization is not evidence that purchases support a specific price today. Current aggregate discretionary insider buying was not verified.
Seasonality adds no valuation premium here. Holiday liquidity and year-end positioning can amplify moves; company disclosures and credit conditions matter more than a calendar tendency.
Valuation: clearly cheaper, but cheap relative to which earnings?
The model uses 24.2 billion diluted shares. Q3 adjusted EPS of $2.68 annualizes to $10.72. Nine-month free cash flow of $113.672 billion annualizes to about $151.6 billion. These are run-rate illustrations, not forecasts.
| Measure | Result / convention |
|---|---|
| P/E on annualized Q3 adjusted EPS | 14.4×; $154.58 ÷ $10.72 |
| P/E on the revised $12 base EPS assumption | 12.9×; original scenario, not consensus |
| Price / annualized nine-month FCF | 24.7× |
| Annualized nine-month FCF yield | About 4.05% |
| EV / modeled FY2027 revenue | About 8.8×; $293.681B actual nine-month revenue plus $130B Q4 guide midpoint |
Enterprise value uses the diluted equity-value proxy less about $21.1 billion net cash, excluding equity investments and lease adjustments. The revenue estimate of $423.7 billion is my combination of reported nine-month sales and Q4 guidance; NVIDIA did not provide that number as full-year guidance.
Cash generation is strong. But a run-rate cash-flow yield does not reserve cash for every future guarantee or commitment. A single-quarter P/E also assumes current earnings are sustainable.
Sources: NVIDIA Q3 FY2027 earnings release, November 17; SEC: supplemental financial information, October 25 quarter; SEC: Q3 FY2027 CFO commentary and reconciliation.
Vendor snapshots put forward P/E around 10–11× for NVDA, versus approximately 36× for AMD and 21× for Broadcom. Historical NVDA year-end forward multiples were roughly 27–53× across FY2023–FY2026. These estimates use differing forecast periods and accounting conventions, so I do not substitute them for a transparent earnings model.
Vendor ROIC—return on invested capital—was about 97%, consistent with very high recent profitability. Equity gains, balance-sheet definitions, and the expanding commitments limit a mechanical comparison. Independent current GPU market-share percentages were not verified.
Sources: Stock Analysis: intraday NVDA statistics and estimate conventions; Stock Analysis: NVDA valuation history; Stock Analysis: AMD valuation snapshot; Stock Analysis: Broadcom valuation snapshot.
Revised scenarios: higher base earnings, lower valuation allowance
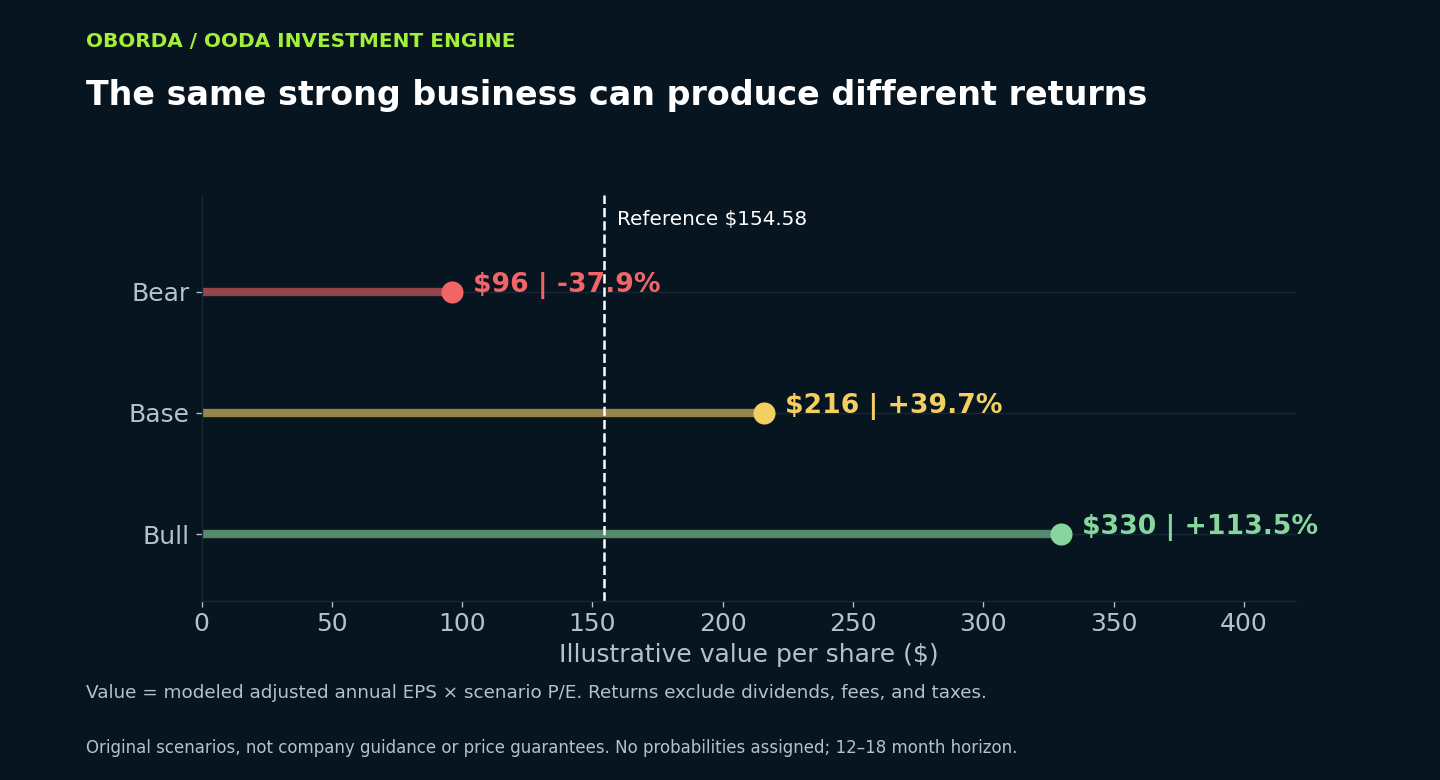
These are original 12–18 month FY2028 scenarios, not management guidance or analyst targets. EPS equals modeled revenue × net margin ÷ 24.2 billion shares; value equals EPS × P/E. A P/E multiple is the price investors pay for each dollar of annual earnings.
| Case | Revenue / modeled net margin | Adjusted EPS × P/E | Value | Return from $154.58 |
|---|---|---|---|---|
| Bear | $390B / 49.6% | $8 × 12 | $96 | −37.9% |
| Base | $550B / 52.8% | $12 × 18 | $216 | +39.7% |
| Bull | $650B / 55.8% | $15 × 22 | $330 | +113.5% |
The base case raises EPS from the old $10 assumption to $12, reflecting stronger reported sales and the latest outlook, but reduces the multiple from 24× to 18× for the unresolved risks. Base value therefore falls from $240 to $216. The bear value falls from $120 to $96 as its multiple falls from 15× to 12×. Bull value remains $330: higher EPS replaces the earlier, more generous multiple.
The base outcome offers about 40% upside, against 38% downside to the bear outcome—only about 1.05 times as much upside as downside. At $150 that ratio improves to about 1.22; at $140, about 1.73. These ratios ignore probabilities and are not a complete measure of risk.
I do not assign a formal probability-weighted expected return because the investigation’s financial consequences cannot be estimated credibly. The scenario returns make the assumptions inspectable; losses can exceed the bear case.
Six revised NVDA zones: the previous buying ranges are superseded
The old operating-strength thesis survives this review. The old buying map does not survive unchanged: support broke, leadership changed, and the financial commitments and margin outlook require a fresh safety allowance.
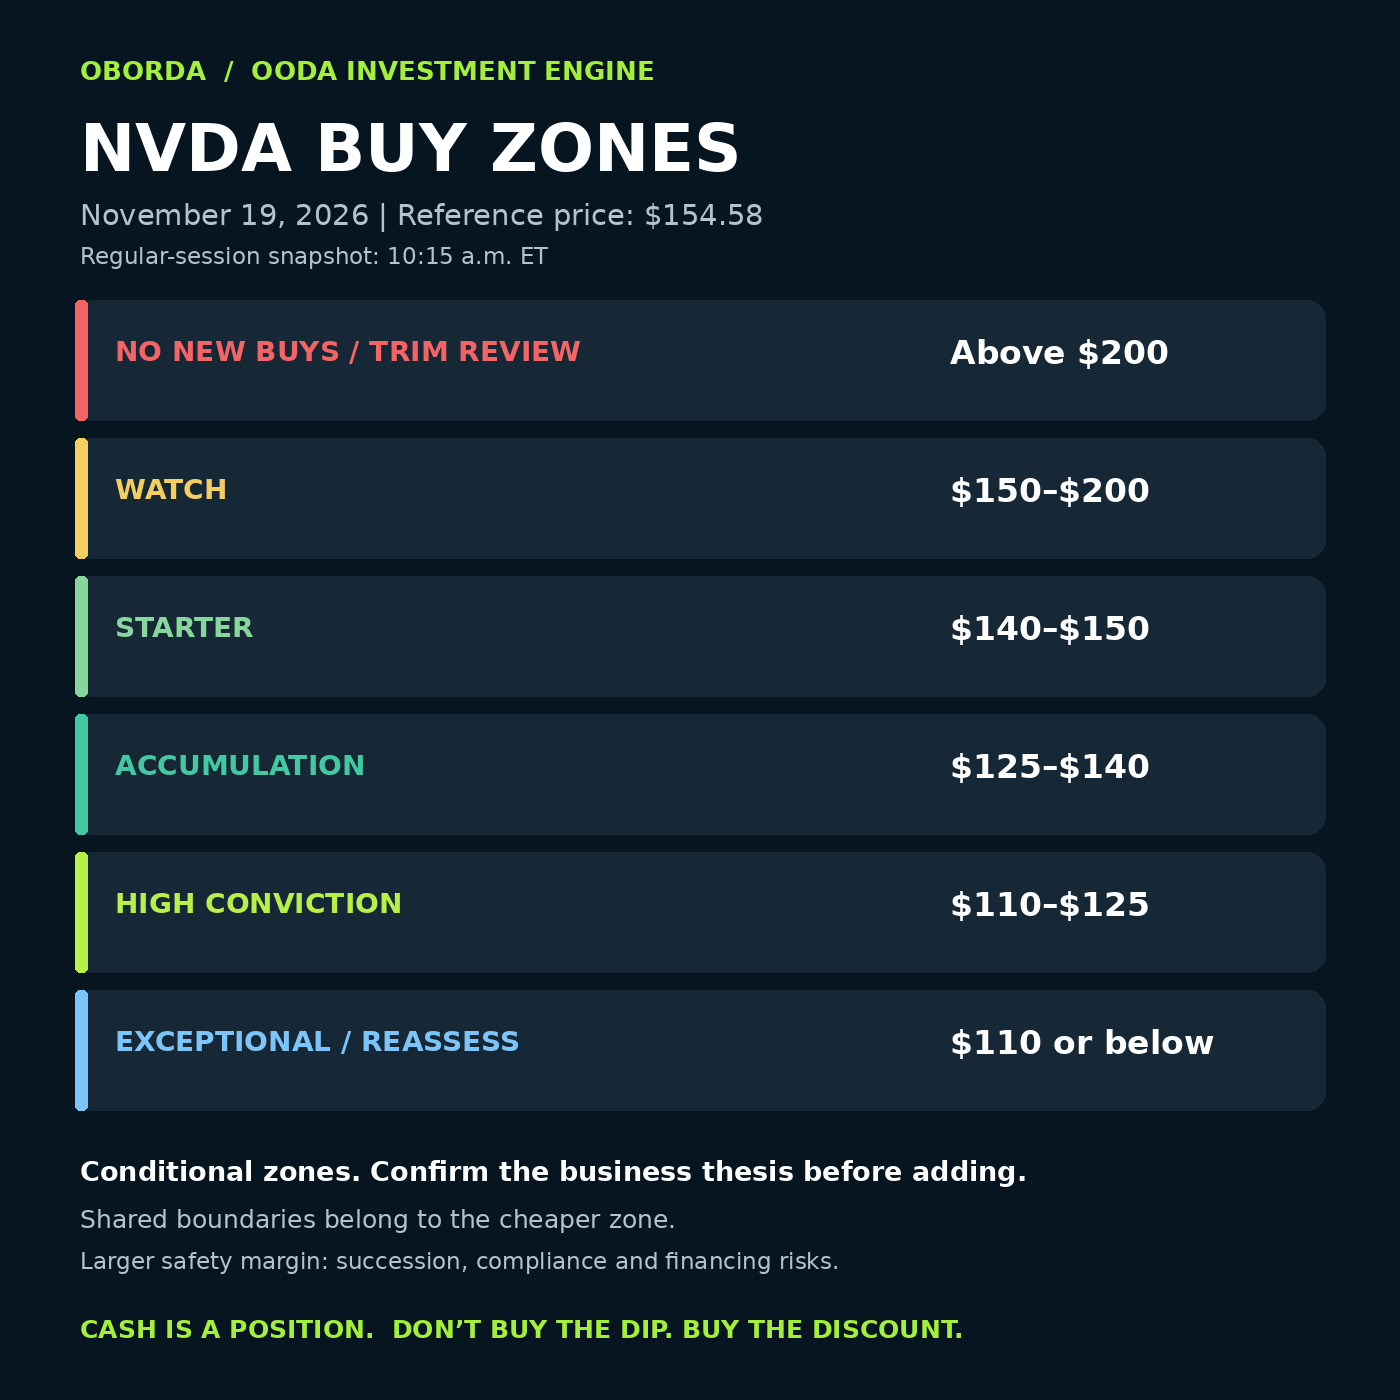
| Zone | Previous display | Revised display | Evidence and rationale |
|---|---|---|---|
| No New Buys / Trim Review | $220 and above | Above $200 | Lower the threshold toward the $200–$210 long-term-average supply cluster. At $200, upside to the $216 base case is only 8%, against 52% downside to $96. |
| Watch | $175–$220 | $150–$200 | The watch region now covers the early rebound above the new $148.80 low; the former $164–$166 support has failed. |
| Starter | $165–$175 | $140–$150 | The upper boundary is near the new low, rather than the broken old support. $140 is a rounded valuation/risk threshold: about 11.7× base EPS or 17.5× stress EPS. |
| Accumulation | $150–$165 | $125–$140 | Requires more protection against margin, compliance, and credit risks. $125 is about 10.4× base EPS or 15.6× stress EPS. |
| High Conviction, conditional | $135–$150 | $110–$125 | Applies only with intact demand, credible collections, and materially clearer governance. At $110, base P/E is about 9.2× and stress P/E about 13.8×. |
| Exceptional / Reassess | Below $135 | $110 or below | A deeper threshold triggers a full earnings and exposure rebuild. Price alone cannot establish exceptional value. |
The $200 and $150 transitions have chart references; $140, $125, and $110 are valuation and margin-of-safety thresholds, not verified historical support. Practical ranges reflect volatility and judgment rather than false precision.
Exact-boundary rule: $200 belongs to Watch; $150 Starter; $140 Accumulation; $125 High Conviction; and $110 Exceptional / Reassess. Each ordinary band excludes its lower endpoint and includes its upper endpoint.
For perspective only, 5%, 10%, 15%, 20%, 25%, and 30% corrections from $243.37 correspond to about $231.20, $219.03, $206.86, $194.70, $182.53, and $170.36. Those reference marks did not generate the zones.
Catalysts, risks, and what would change my mind
Potential catalysts: Rubin deployments converting into cash, successful execution under interim leadership, credible investigation findings, better collection times, and margins stabilizing after the ramp. AWS expansion plans and the software ecosystem support the opportunity, but already-public announcements should not be counted twice as fresh upside.
Principal risks: adverse compliance findings, export restrictions, customer financing stress, guarantee calls, excess supply commitments, rising inventories, weaker cash conversion, custom-chip competition, manufacturing or packaging constraints, and sustained margin compression. Strong recurring software economics should not be assumed for all hardware revenue.
- Pause additions if guidance signals a sustained demand reset, collection time keeps rising, or promised deployments fail to turn into cash.
- Rebuild the thesis if confirmed compliance failures lead to material penalties, restrictions, or customer losses.
- Reassess if gross margins remain below the new 71%–72% outlook beyond an understandable transition period.
- A sustained break below $148.80 invalidates the immediate support setup; it does not alone prove the business thesis broken.
- Clearer governance, a credible CEO appointment, improved collections, and sustained technical repair could justify raising the zones again.
Confidence and material information still missing
Confidence: Moderate in the wait decision; low-to-moderate in exact lower boundaries. Strong revenue and cash generation support the business case. Succession, compliance outcomes, future liabilities, and technical weakness limit confidence.
The Q3 10-Q was not verified as filed. Full legal conclusions, commitment overlap and enforceability, current institutional and options flows, fresh discretionary insider-buying totals, complete advance/decline breadth, and independently verified market-share changes were unavailable. No stock-specific seasonal premium or numerical investigation probability is invented.
Prices are timestamped, financial figures are reported or guided as labeled, and scenarios are original assumptions. No current share count, cost basis, or portfolio concentration is assumed for the reader.
Related reading: A Good Company Isn’t Always a Good Buy. An educational framework is not a personalized allocation instruction.
Sources and method
Company releases and the SEC earnings exhibits support financial figures; government statements support the investigation status. Vendor data support dated prices and technicals. The full source list is below. Calculations, scenarios, and zone judgments belong to this assessment.
Open the research source list
- NVIDIA Q3 FY2027 earnings release, November 17
- SEC: Q3 FY2027 CFO commentary and reconciliation
- SEC: supplemental financial information, October 25 quarter
- SEC: November 17 earnings Form 8-K and exhibits
- NVIDIA: CEO transition announced November 12
- SEC: resignation accepted November 11; Form 8-K dated November 12
- NVIDIA Board statement, November 8
- NVIDIA independent directors: outside counsel, November 10
- DOJ and Commerce: official Megaspeed investigation statement
- Associated Press: Megaspeed response and unresolved claims, November 15
- Stock Analysis: timestamped NVDA quote and daily price history
- Quiver: completed prices, including September 10
- Stock Analysis: NVDA overview and 52-week range
- Barchart via Raymond James: completed-session technicals
- Wall Street Numbers: dated RSI and moving-average history
- Stock Analysis: intraday NVDA statistics and estimate conventions
- Stock Analysis: NVDA valuation history
- Stock Analysis: AMD valuation snapshot
- Stock Analysis: Broadcom valuation snapshot
- Stock Analysis: SOXX daily and intraday comparison
- Stock Analysis: SMH daily and intraday comparison
- Associated Press: November 18 market close
- eOption: November 19 premarket context, not live index quotes
- Federal Reserve: October 28 policy statement
- U.S. Treasury: November 18 interest-rate snapshot
- BLS: October 2026 Consumer Price Index
- WiseView: November 18 VIX snapshot
- MarketBeat: October 30 short-interest settlement
- NVIDIA: AWS deployment plans and infrastructure collaboration
- NVIDIA: agreement to acquire Hugging Face, September 3
- NVIDIA corporate history
- NVIDIA investor FAQs: IPO history
- FAA: ground-stop investigation and technical findings
- ABC News: recent outage causes and company responses
- OBORDA: November 11 NVDA reassessment
- SEC: Q2 FY2027 10-Q, preliminary financing arrangements
- Wall Street Journal: financing pledges and deployment report, November 19
- The Guardian, citing Bloomberg: reported CEO approaches, November 19
- Rosen Law: plaintiffs’ securities allegations; attorney advertising
- Wall Street Numbers: dated moving-average readings
- Wall Street Journal: reported SEC civil inquiry, November 17
- Reuters: inquiry report and requests for comment, November 17
- House Energy and Commerce: November 18 briefing request to Colette Kress
Observe → Orient → Decide → Act
Observe: Q3 sales and cash generation were strong. The company announced a CEO transition; Q4 margins are guided lower; the stock remains below its major completed-session averages.
Orient: Valuation has become more attractive, but unresolved governance and financing exposures justify a larger safety margin. An investigation is not proof of wrongdoing, and a strong quarter does not resolve every risk.
Decide: At the $154.58 regular-session snapshot, my action is Watch—keep new money in cash. The revised starter region is $140–$150, conditional on stabilization and an intact thesis. Existing positions should be assessed for concentration and ability to tolerate the stress case before adding.
Act: Wait for a higher low, a credible support retest, and clearer disclosures. Buy in stages only when price and evidence agree. Review concentrated positions for possible trimming into $189–$210 supply. Reassess immediately on material findings or guidance changes; update standing limit orders before major disclosures.
Cash is a position. Staggered purchases. No all-ins. Buy the discount, not just the dip.