


OBORDA • OODA Investment Engine • November 13, 2026
VGT is Vanguard’s Information Technology ETF. It tracks the MSCI US Investable Market Information Technology 25/50 Index, which includes U.S. technology companies across software, hardware, and semiconductors. Although it holds hundreds of stocks, much of its performance depends on a few large companies, including NVIDIA, Apple, and Microsoft. Fund overview and holdings.
VGT buy zones are becoming more interesting after a 16.06% correction. But a lower price is only the beginning of the analysis. The question is whether the discount now compensates for valuation, technical damage, and a major leadership change at its largest reported holding.
My assessment: VGT has entered a conditional starter range. It has not earned an aggressive accumulation signal. I want stabilization or stronger evidence before committing meaningful new money. Cash is a position.
VGT snapshot: a correction deserves attention, not an automatic buy
| Measure | Reading |
|---|---|
| Reference price | $109.68 |
| Previous close | $113.09 |
| 52-week high | $130.66 on October 6, 2026 |
| 52-week low | Approximately $83.09; vendors differ slightly |
| Correction from the high | −16.06% |
| Broad market | Mixed/rotational, with defensive pressure |
| Technology | Defensive; intermediate trend remains damaged |
The calculation is straightforward: ($109.68 − $130.66) ÷ $130.66 × 100 = −16.06%. That discount gets my attention. It does not, by itself, establish value.
All prices use the current share-price scale. Vanguard announced an 8-for-1 VGT share split earlier in 2026. A split changes the share count and nominal price; it does not make the portfolio cheaper.
Six VGT buy zones—and why each boundary exists
These ranges combine technical structure, business quality, valuation sensitivity, and current uncertainty. They are allocation guides, not standing orders. At a shared boundary, use the more cautious zone until confirmation.
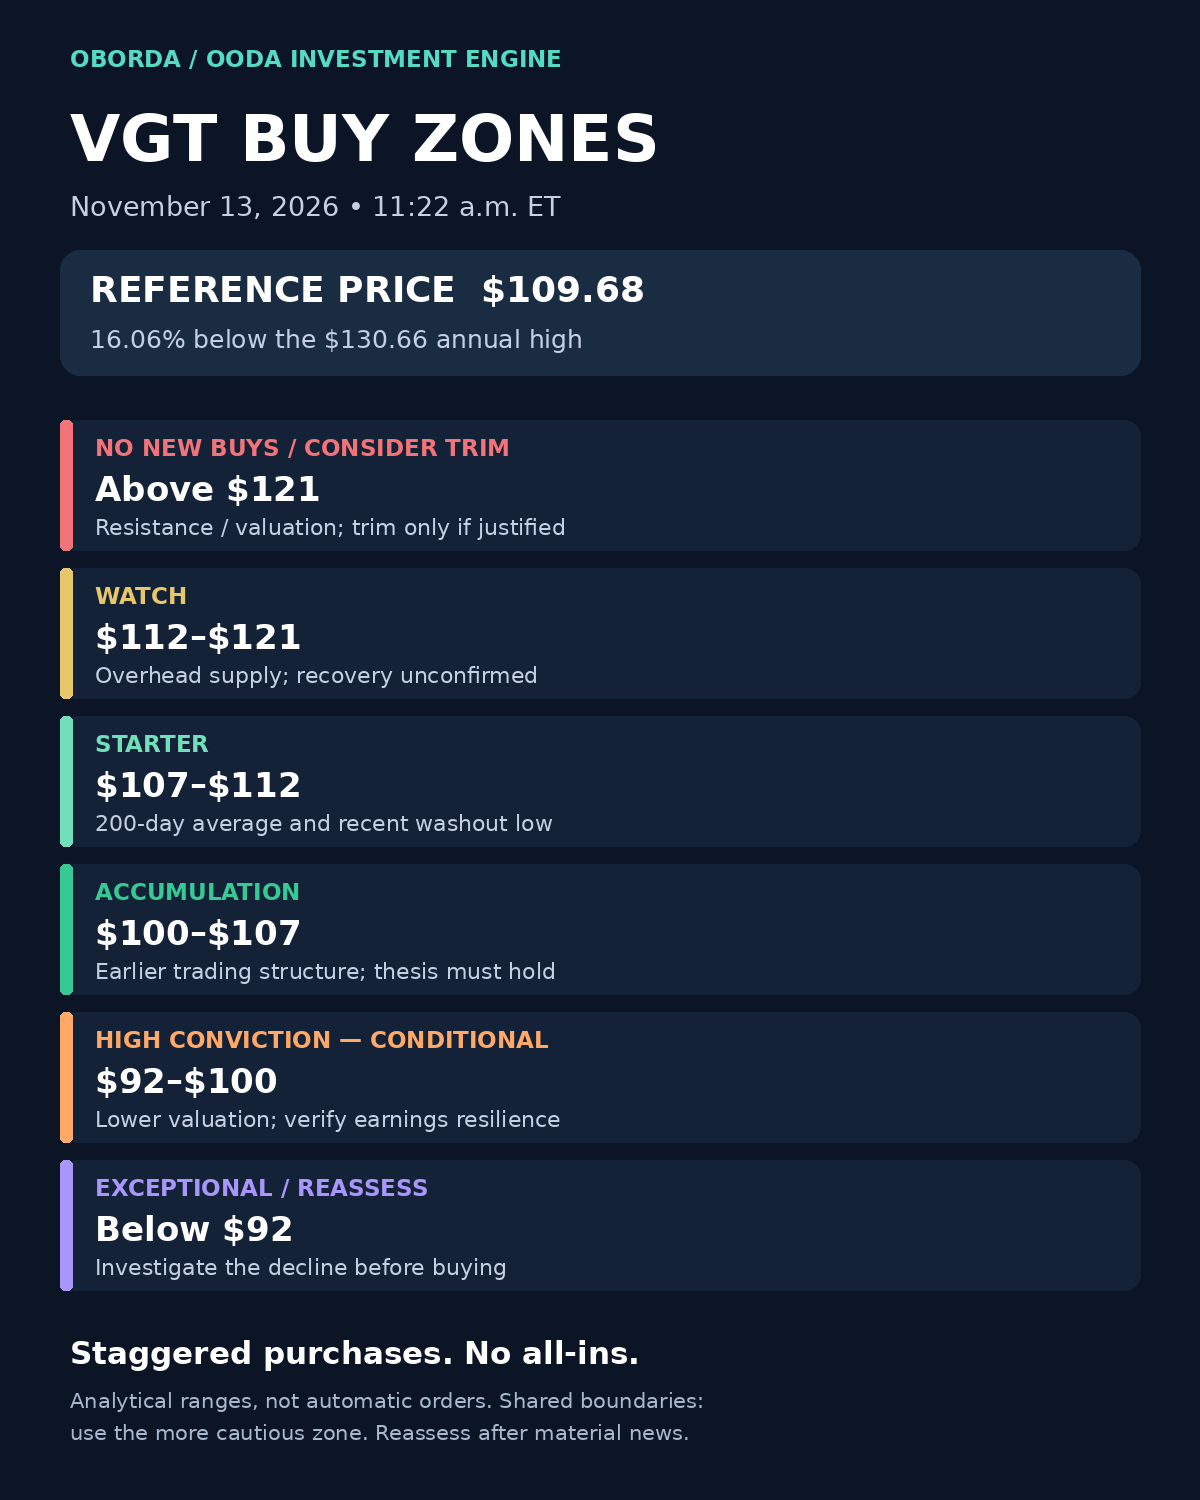
| Zone | Price | Why this range matters |
|---|---|---|
| 🔴 No New Buys / Consider Trim | Above $121 | The approximate 50-day average and October congestion create overhead resistance. The valuation proxy is about 32× near this boundary. A rapid rebound could justify reducing an overweight position; a durable earnings-supported breakout requires reassessment. |
| 🟡 Watch | $112–$121 | Recent rebound trading gives way to resistance around $115, the 20-day average near $117, and broken support around $118–$121. The discount is less compelling while event risk remains unresolved. |
| 🟢 Starter | $107–$112 | Contains the approximate $110 200-day average and the November 5 low of $106.89. This is the strongest nearby technical foundation for a small first purchase, provided support stabilizes. |
| 🟢🟢 Accumulation | $100–$107 | Extends below the washout low toward April trading around $100–$103 and May trading around $104–$106. The unchanged-earnings valuation proxy falls to about 26–28×. A support break still needs confirmation before adding. |
| 🔥 High Conviction—conditional | $92–$100 | Overlaps an earlier trading range, including January’s approximately $92–$97 range. The proxy falls to about 24–26×. Earnings resilience must justify conviction; these older levels are less firmly verified than nearby support. |
| ⚡ Exceptional / Reassess | Below $92 | A move beneath that earlier range signals a larger change in expectations. The approximately $83 annual low becomes a reference, not a guaranteed floor. Investigate whether earnings or only valuation are falling. |
The boundaries are rounded deliberately. Nearby levels have stronger technical evidence; deeper levels rely more heavily on valuation and older price structure. Supporting data: daily prices, moving averages, and historical ranges.
Market message: the rebound has not repaired the trend
At the snapshot price, VGT was testing slightly below its approximately $110 200-day average. Its 20-day average was near $117 and its 50-day near $121. That structure places meaningful resistance above the current price.
Prior-close RSI was approximately 42, with negative MACD. Momentum was weak, without an extreme oversold reading. November 5’s 7.35% decline traded about 16.2 million shares; subsequent rebound sessions generally attracted less volume. Selling pressure has not been decisively overcome.
The rebound reached roughly $115 before retreating. November 11 opened above the preceding session’s high, but the snapshot decline retraced that gap. Former support around $118–$121 now represents potential overhead supply. This is a recovery attempt, not a confirmed new uptrend.
Technical references: price and volume, averages, and momentum indicators. These indicators reflect prior completed sessions and may vary with vendor adjustment methods.
Rates, inflation, sector rotation, and seasonality
The October 28 Fed statement held the policy range at 3.75–4.00%, described inflation as elevated, and recorded two dissenters favoring a hike. October CPI rose 0.4% monthly; the November 13 PPI release reported 0.3% monthly and 6.5% yearly inflation.
A morning market report put the 10-year Treasury yield near 5.15%. Higher yields increase the hurdle for premium growth valuations.
Through Thursday, the S&P 500 and Nasdaq were still up about 2.9% and 3.2% for the week despite Thursday declines, according to AP’s market summary. My broad-market classification is mixed/rotational with defensive pressure. VGT’s weakness combines macro pressure with concentrated company risk.
XLK was also attempting to recover its 200-day average earlier in the week, indicating wider sector damage. A synchronized VGT/SPY relative-strength series and current market-wide breadth were not verified; I am not assigning a precise relative-strength ranking.
Seasonality receives no positive adjustment. No VGT-specific seasonal study was verified for this report. Calendar tendencies do not override earnings, yields, or price structure.
Fundamentals: strong businesses, concentrated exposure
VGT tracks U.S. information technology companies. It is a sector allocation, and its corporate fundamentals must be assessed through the businesses it owns.
Vanguard’s September 30 fact sheet reports 318 stocks, a 0.09% expense ratio, 38.1% portfolio return on equity, and 35.2% reported earnings growth. NVIDIA, Apple, and Microsoft represented about 44.7% combined; the top ten represented 63.7%. Semiconductors and semiconductor equipment together accounted for approximately 43.6%.
Those are dated portfolio statistics, not live weights. The portfolio offers exposure to recurring software revenue, platform ecosystems, pricing power, and valuable chip capabilities. The number of holdings does not eliminate concentration or capital-intensity risk. Portfolio ROE is not ROIC, and buybacks can influence it.
Earnings and guidance: operating strength with demanding expectations
| Holding | Latest verified evidence | What I take from it |
|---|---|---|
| NVIDIA | Quarterly revenue $96.2B, up 106%; gross margin 75%. Previously issued next-quarter revenue guidance: $108B ±2%. | Strong demand, but guidance now needs to be tested against leadership uncertainty. |
| Microsoft | Revenue $92.3B, up 19%; Azure growth 48%. Next-quarter revenue guidance $96–$97.1B and Azure growth of 49–50% in constant currency. | Cloud demand supports the earnings thesis. |
| Apple | Revenue $114.5B, up 12%; EPS up 14%; operating cash flow $28B. Tariff refunds benefited margin and EPS. | Operating resilience, with part of reported profitability helped by a special factor. |
| Broadcom | Revenue $29.6B, up 86%; FCF $13.7B. Next-quarter revenue guidance about $34.8B. | AI networking and custom-chip demand remain strong; the expectations hurdle is high. |
These figures come from company releases linked in the sources below. They cover selected dominant holdings, not an audited aggregation of every constituent.
Microsoft’s $677B remaining performance obligations support future revenue, although quarterly bookings declined against a difficult comparison. Quarterly capex was $45.2B, compared with free cash flow of $18.6B; management expects next-quarter capex above $50B. Infrastructure spending benefits suppliers while increasing the return-on-investment burden on buyers.
VGT valuation: the discount is real, but growth is still required
Vanguard reported VGT at 32.8× earnings on September 30 versus 24.7× for VOO on the same date—a premium of roughly 33%. Better reported growth and profitability support some premium; they do not justify every price.
To make these zones explainable, I use a constant-portfolio earnings proxy: $125.67 September 30 price ÷ 32.8 = $3.83. At $109.68, that implies about 28.6× unchanged September earnings, or a 3.5% earnings yield.
This is a sensitivity model, not verified current forward EPS. Portfolio changes, updated earnings, and Vanguard’s aggregation methodology can change the result. Earnings yield is not a cash distribution or a bond-equivalent return. A consistent long-term valuation series was not verified, so I am not claiming VGT is historically cheap.
| Price boundary | Implied P/E using unchanged proxy |
|---|---|
| $121 | 31.6× |
| $112 | 29.2× |
| $107 | 27.9× |
| $100 | 26.1× |
| $92 | 24.0× |
Expected upside and downside: 12–18-month scenarios
The following are explicit analytical assumptions, not consensus forecasts or price guarantees. The calculation is $3.83 earnings proxy × earnings-change factor × exit P/E. Returns exclude distributions and taxes.
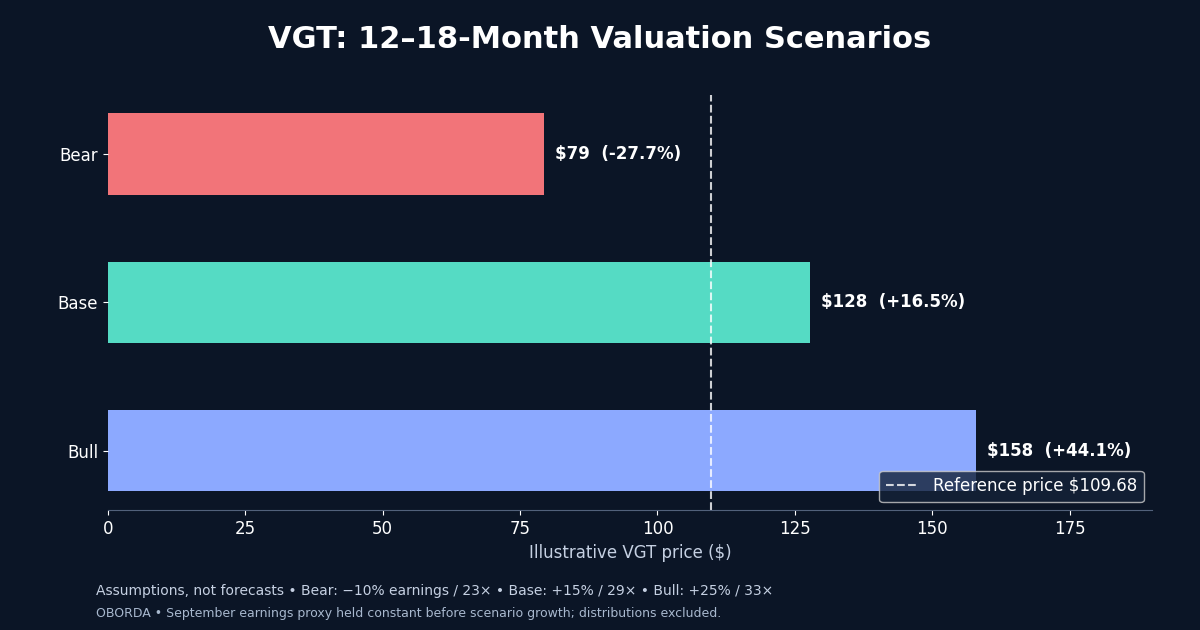
| Scenario | Earnings change | Exit P/E | Implied price | Return |
|---|---|---|---|---|
| Bear | −10% | 23× | $79 | −27.7% |
| Base | +15% | 29× | $128 | +16.5% |
| Bull | +25% | 33× | $158 | +44.1% |
The base case assumes continued earnings growth at a lower multiple than September’s. The bear case combines earnings contraction and multiple compression. The bull case requires strong growth and a sustained premium.
An illustrative 30% bear / 50% base / 20% bull weighting produces about $119, or 8.8% price upside. Those probabilities are judgment calls, not statistically estimated odds. Base-case upside compared with bear-case downside is only about 0.6:1. That is a reason to control entry size.
Catalysts, flows, and the risks that could change the plan
The principal catalysts are sustained AI infrastructure demand, cloud monetization, product execution, and easing inflation or yields. Much of the AI growth is already visible in results and guidance. Further upside needs delivery that exceeds current expectations.
Risks include NVIDIA’s leadership transition, earnings disappointment, weak returns on AI spending, chip cyclicality, competition, export restrictions, and persistently high yields. Strong sales can coexist with weak investment returns when the valuation multiple contracts.
ETF Channel’s November 12 report shows about $1.2B of weekly VGT inflows, alongside inflows into XLK and SMH. That does not establish a bottom. ETF creations, underlying shareholder selling, rebalancing, rotation, and profit-taking can coexist.
No verified current short-interest or dealer-positioning evidence establishes shorts as the cause of the decline. Underlying company buybacks can support demand; they do not guarantee support at a particular price.
What would invalidate the thesis?
- AI orders, cloud growth, and guidance deteriorate across several major holdings.
- Capital spending persistently outpaces monetization and damages cash generation.
- NVIDIA’s transition disrupts customers, execution, or financial credibility.
- Higher yields make the assumed valuation multiples unsustainable.
A sustained break below $106.89 invalidates the nearby support setup, not automatically the long-term business thesis. Acceptance below $100 requires a fresh technical and valuation assessment. A lower price does not override a broken thesis.
Confidence and unavailable information
Moderate confidence in long-term business quality; low-to-moderate confidence in near-term timing and deeper zone boundaries. Strong operating evidence supports the thesis, while governance uncertainty, technical weakness, and valuation sensitivity limit conviction.
Not sufficiently verified: live issuer holdings and NAV premium/discount; aggregate current forward earnings, FCF yield, debt, and ROIC; a consistent historical valuation series; synchronized breadth and VGT/SPY relative strength; comprehensive constituent guidance revisions; and current short/options positioning. Small vendor differences in adjusted prices and averages also limit precision. These gaps prevent a high-confidence bottom call.
OODA: what action is justified at $109.68?
Observe: VGT is 16.06% below its annual high and testing its 200-day average.
Orient: The largest reported holdings show strong growth, but valuation, technical weakness, and November 17 NVIDIA earnings leave meaningful downside.
Decide: Treat this as a conditional starter range. Defer meaningful accumulation until price stabilizes or the earnings picture becomes clearer.
Act: At the stated snapshot, I favor waiting for stabilization around $107–$110 or reassessing after November 17. If initiating beforehand, keep it to a small first tranche. Existing positions should fit the intended technology allocation. A rapid rebound toward $121–$128 could justify trimming excess concentration; it is not an automatic sell signal.
Buy the discount, not just the dip. The next action should follow the next evidence.
Sources and research notes
Research snapshot: November 13, 2026. Dates and reporting periods differ as identified above. Linked pages may subsequently update.
- Vanguard VGT fact sheet — September 30 portfolio, concentration, expense ratio, and valuation.
- Stock Analysis: VGT history — intraday snapshot and daily price/volume history.
- FinanceCharts: VGT price history — annual range and older price references.
- AlphaQuery and Stock Setups — technical indicators.
- StatMuse price history — older monthly trading-range reference; less weight than nearby verified daily structure.
- NVIDIA Q2 FY2027 SEC earnings exhibit — results and previously issued outlook.
- NVIDIA CEO transition announcement — November 12 leadership update and earnings schedule.
- Microsoft FY2027 Q1 results and earnings call — earnings, RPO, capex, cash flow, and guidance.
- Apple FY2026 Q4 results and Broadcom FY2026 Q3 results.
- Vanguard VOO fact sheet — same-date broad-market valuation comparison.
- Federal Reserve, BLS CPI, and BLS PPI — policy and inflation.
- ETF Channel flows report — weekly fund-creation estimate.
- MarketWatch: XLK technical context — November 11 sector recovery attempt.
OBORDA shares an investment research process for educational purposes. Scenario values and zones are conditional estimates, not guaranteed outcomes or individualized investment advice.