


OODA Investment Engine • November 13, 2026
What is QCOM—and who does Qualcomm work with?
QCOM is the Nasdaq ticker for Qualcomm Incorporated. Qualcomm develops chips and wireless technology used in smartphones, vehicles, connected devices and computing. Snapdragon is its best-known consumer platform. The business earns money in two principal ways: selling semiconductor products through QCT and licensing intellectual property through QTL.[1]
That distinction matters. A customer can reduce purchases of Qualcomm chips while continuing to license its patents. Understanding those relationships is essential before deciding whether QCOM stock offers a real discount.
| Relationship | How it works | Why investors should care |
|---|---|---|
| Apple | A modem customer transitioning toward its own chips, and a separate patent licensee. Qualcomm announced a renewed global patent agreement effective April 1, 2027. | Fewer modem sales pressure QCT. They do not automatically eliminate QTL licensing revenue. |
| Samsung and Android device makers | Samsung is a major customer and licensee; its own processors also compete in some devices. Snapdragon powers selected premium Galaxy products. | A partner can also be a competitor. Device mix, customer chip choices and demand affect Qualcomm’s revenue. |
| Amazon / AWS | A September 2026 collaboration covers custom silicon for AI infrastructure and optical connectivity. | Creates a path beyond phones, with execution and profitability still to prove. |
| TSMC and other foundries | Qualcomm relies on external foundries, including TSMC and Samsung, for important chip manufacturing. | Design capability does not remove manufacturing capacity, cost or geopolitical exposure. |
| Arm | Qualcomm licenses architecture-related intellectual property from Arm. Their relationship also includes litigation and growing competitive tension. | Licensing access, terms and legal outcomes remain risks. |
| Automakers and connected-device customers | Qualcomm supplies processing and connectivity platforms across automotive and IoT applications. | Diversification can reduce handset dependence over time, but design wins are not guaranteed revenue. |
Relationship sources: Qualcomm’s annual filing and Apple, Samsung and Amazon announcements. Samsung’s partnership announcement is historical context, not a new November 2026 development.[1], [4], [5], [6]
My current take: Watch at $169.64. A roughly 35% decline earns attention. It does not automatically earn my money. I want a better entry—or clearer evidence that earnings are stabilizing—before treating QCOM as an attractive new purchase.
Analysis snapshot: November 13, 2026, 11:51 a.m. ET. Prices below preserve that timestamp and are not a live quote.
QCOM stock: the decline needs an explanation
| Measure | Verified snapshot |
|---|---|
| Share price | $169.64 at 11:51 a.m. ET, November 13 |
| Previous close | $177.14 on November 12 |
| Intraday change | −4.23% |
| 52-week high / low | $259.92 / $121.99 |
| Correction from high | −34.73% |
| Market classification | Risk-off in technology; broader stress elevated |
Price and range references: Stock Analysis. The quote and range were retrieved from pages with different refresh times.[7]
Correction calculation: ($169.64 − $259.92) ÷ $259.92 × 100 = −34.73%.
Two forces are operating together: Qualcomm’s own earnings reset and selling across technology. Treating the entire decline as market noise would overlook the business pressure. Treating it entirely as a Qualcomm problem would overlook the sector backdrop.
A broader business, with a pressured earnings base
Qualcomm’s diversification gives me reasons to keep watching. Its wireless expertise, patent portfolio and established customer relationships have value. But growth outside phones must translate into durable earnings and cash flow.
| Financial measure | Result / implication |
|---|---|
| FY2026 revenue | $43.12 billion, down 2.6% |
| FY2026 adjusted EPS | $10.54 |
| Q4 adjusted revenue / EPS | Approximately $10.4 billion / $2.17 |
| Q1 FY2027 guidance | Revenue $10.4–$11.2 billion; adjusted EPS $2.15–$2.35 |
| Q4 segment profitability | QCT pretax margin 24%; QTL pretax margin 70% |
Results and guidance come from Qualcomm’s earnings materials; adjusted measures differ from GAAP.[2], [3]
Management expects a $5 billion data-center business in FY2027. That is a target, not booked revenue. Price increases may help offset higher chip costs, with fuller benefits expected in the second half of FY2027. Investment before the data-center ramp also weighs on near-term segment margins.[2], [3]
Cash flow deserves more weight than the headline P/E
Operating cash flow of $11.145 billion minus $2.494 billion in capital expenditures produced $8.651 billion of free cash flow, down about 32.5% from the prior year. Buybacks and dividends totaled $11.67 billion—more than annual free cash flow. Those distributions help shareholders, but cannot be assumed to continue at that pace without stronger cash generation.[2]
The company reported $7.68 billion in cash and marketable securities against $15.11 billion of issued debt and commercial paper. Liquidity is adequate, but Qualcomm is a net borrower. GAAP earnings also benefited from a $5.7 billion tax allowance reversal, making the low headline trailing P/E a poor stand-alone measure of recurring value.[1]
Business assessment: mixed. The diversification opportunity is strengthening while handset-related earnings and cash flow face pressure. I would not call that an unchanged thesis.
The rebound has not established a durable recovery
On November 5, QCOM fell 9.49%, hit $148.25 and closed at $156.75 on roughly 40.2 million shares. It then recovered to $177.14 by November 12. The rebound matters, but its lighter volume makes the recovery less convincing than the headline percentage suggests.[8]
| Technical area | Interpretation |
|---|---|
| $182–$183 | Recent swing-high resistance |
| $175–$179 | Recovery resistance and approximate 50-day moving-average area |
| Around $170 | Approximate 200-day moving average; being tested at the snapshot price |
| $163, then $159–$157 | Recent lows and the post-earnings closing area |
| Around $148 | November 5 washout low; failure would damage the recovery structure |
Daily moving-average sources broadly place the 50-day near $179 and the 200-day near $170, although exact readings differ. Momentum is neutral to weakening. I am using broad technical areas rather than pretending a specific penny or conflicting MACD reading is decisive.[7], [8]
QCOM valuation: cheaper than the high, but is it cheap enough?
The retrieved FY2027 analyst earnings reference is $9.59 per share, down from $10.17 after earnings. It is an estimate, not company guidance. At $169.64, that means about 17.7 times forward earnings.[10]
| Calculated valuation at $169.64 | Reading |
|---|---|
| Price / FY2026 adjusted EPS | 16.1× |
| Price / FY2027 analyst EPS reference | 17.7× |
| Price / trailing FCF per share of $8.09 | 21.0× |
| Trailing free-cash-flow yield | 4.8% |
| Indicated dividend yield at $3.68 annually | 2.2% |
Historical fiscal-year-end forward P/E observations include roughly 12.7×, 15.7× and 14.2× for FY2023–FY2025. Those points are context, not a fixed fair-value rule. Qualcomm can deserve a higher multiple if diversification produces stronger growth. It should not receive that premium automatically.[7], [9]
Broadcom, MediaTek and NXP are useful comparisons, but their business mixes and forecast periods differ. Consistent current peer multiples were not reconciled, so I have not justified these zones through an assumed peer discount.
What could the return look like?
These are my illustrative 12–18-month valuation assumptions. They are not forecasts, company guidance or analyst price targets. Price returns exclude dividends.
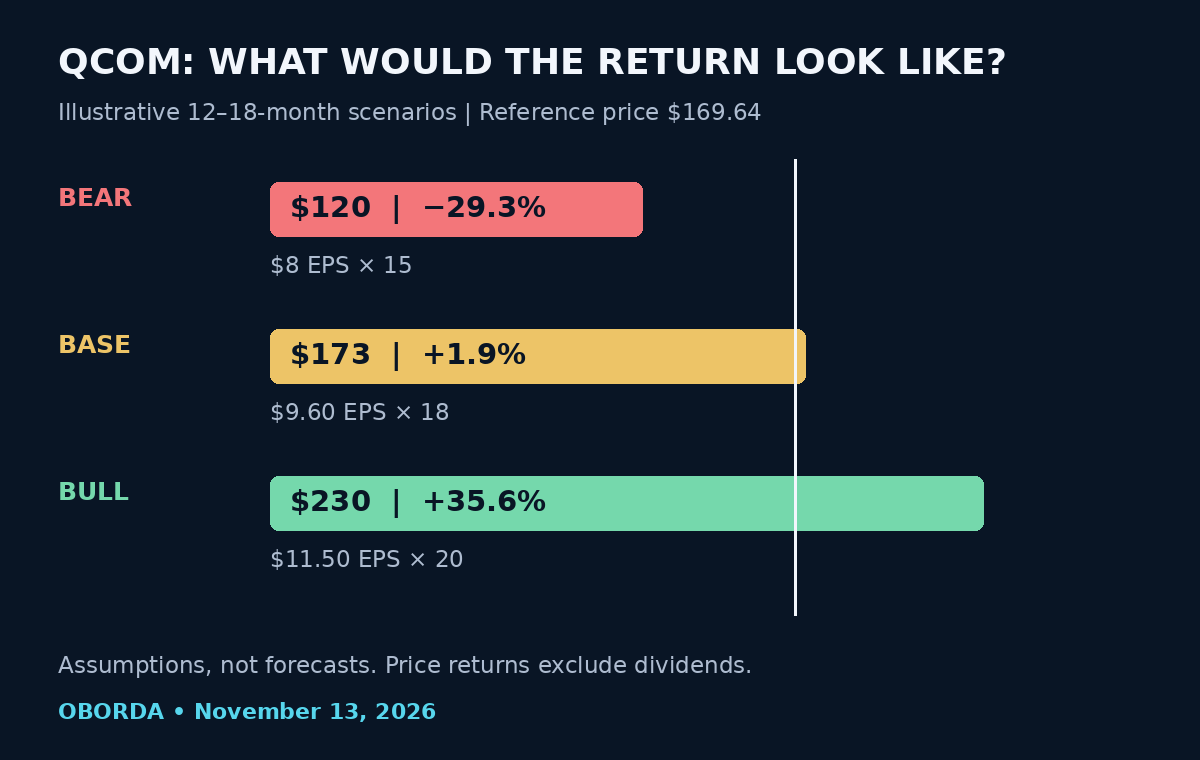
| Scenario | Assumed EPS × P/E | Implied price | Price return |
|---|---|---|---|
| Bear | $8.00 × 15 | $120 | −29.3% |
| Base | $9.60 × 18 | $172.80 | +1.9% |
| Bull | $11.50 × 20 | $230 | +35.6% |
Subjective weights of 30% bear, 45% base and 25% bull give a weighted value of $171.26, or only about 1.0% price upside. That calculation is sensitive to the assumptions. It illustrates why a large correction can coexist with an unappealing expected return.
At $160, the same base and bull values imply approximately 8% and 44% upside, against 25% downside to the bear case. At $145, they imply approximately 19% and 59% upside, against 17% downside. A lower entry improves the balance only if the earnings assumptions hold.
Six QCOM stock buy zones—and why each boundary exists
These are conditional allocation ranges, not automatic orders. Shared boundaries belong to the lower-priced zone: for example, $165 is in Starter and $155 is in Accumulation.
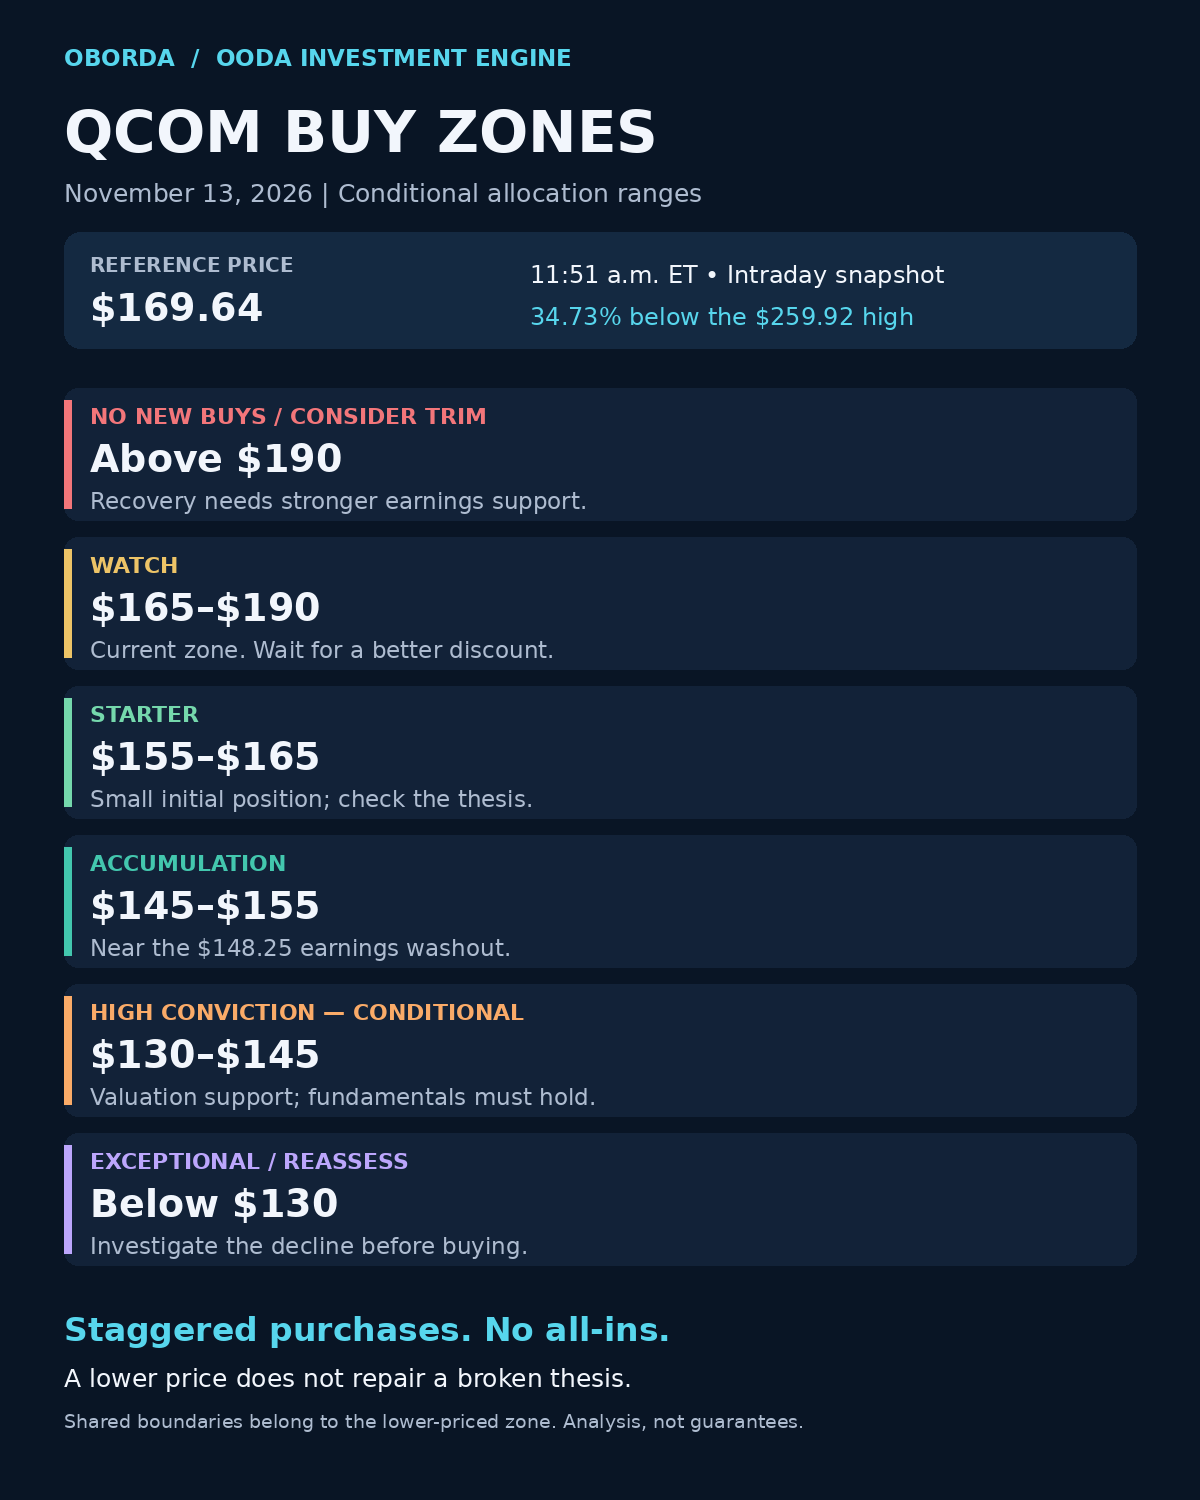
| Zone | Range | Evidence and action |
|---|---|---|
| 🔴 No New Buys / Consider Trim | Above $190 | Above recent $182–$183 resistance and near 20× the $9.59 EPS reference. A recovery needs better earnings visibility. Consider trimming excessive concentration after a fast rise. |
| 🟡 Watch | $165–$190 | Encompasses the approximate $170 and $179 moving averages. Current earnings uncertainty limits the appeal of paying toward the upper end. |
| 🟢 Starter | $155–$165 | Encompasses the $156.75 earnings close and $159–$163 recovery lows. Roughly 16.2–17.2× forward EPS. Small entry only. |
| 🟢🟢 Accumulation | $145–$155 | Brackets the $148.25 washout. Roughly 15.1–16.2× forward EPS and a 5.2–5.6% trailing FCF yield. A more meaningful discount. |
| 🔥 High Conviction—conditional | $130–$145 | Roughly 13.6–15.1× forward EPS. Historical valuation offers support, but verified technical support within this range is less precise. Strong fundamentals remain essential. |
| ⚡ Exceptional / Reassess | Below $130 | Approaches the $121.99 annual low and falls below roughly 13.6× forward EPS. Determine why the price is falling before committing capital. |
The $190 boundary is primarily a valuation hurdle beyond nearby resistance. The $165, $155 and $145 boundaries organize observed recovery and washout areas into practical ranges. The $130 boundary is chiefly a valuation and annual-low reassessment threshold. None is a guaranteed floor.[7], [8], [9], [10]
The market backdrop argues for patience
November 13 reports show a broad technology selloff, with the Nasdaq down around 2% and the S&P 500 down around 1% at the reported intraday observations. QCOM’s weakness is partly company-specific and partly systemic sector pressure. My classification is risk-off in technology; the evidence does not establish a financial-system crisis.[12]
The Federal Reserve held its policy range at 3.75–4.00% in October. The 10-year Treasury yield was reported near 5.13% this morning. Higher discount rates make distant, uncertain growth less valuable and raise the hurdle for paying a premium multiple.[11], [13]
Seasonality: a favorable calendar reputation cannot override earnings, yields or price structure. Qualcomm’s device demand also depends on product-launch cycles. No independently verified stock-seasonality edge is being used to justify these zones.
Flows: retrieved short-interest snapshots are around 3% of shares, with reporting-date differences. That is insufficient evidence to blame the decline on shorts. Institutional filings are delayed; current ETF flows, options dealer positioning and real-time market breadth were not verified. The clearest observable flow evidence is the heavy earnings selloff versus the lighter-volume recovery.[7], [8]
What could improve—or break—the thesis?
| Catalyst | Evidence needed |
|---|---|
| Data-center ramp | Convert targets and announced collaborations into revenue and profitable scaling. |
| Automotive and IoT | Sustain enough growth to offset handset erosion. |
| Pricing actions | Recover costs without materially reducing demand. |
| Licensing renewals | Preserve durable royalty economics. |
| Share repurchases | Reduce dilution and share count within sustainable cash generation. |
These catalysts are already public. The upside depends on results exceeding what the market expects, rather than the announcements simply existing.
Key risks include Apple modem substitution, smartphone demand, competition, margin dilution, customer concentration, China exposure, supply-chain constraints and licensing litigation. A customer relationship can be valuable and still become a source of competitive pressure.
Reassessment triggers
- Forward earnings expectations fall materially below the $9.59 reference.
- The data-center ramp slips or fails to improve profitability over time.
- Licensing economics weaken, or handset erosion exceeds the diversification offset.
- Cash generation keeps deteriorating while distributions remain elevated.
- A sustained break below $148 damages the recovery structure; a break below $122 requires a fresh technical assessment.
Confidence: Moderate in the cautious stance; low-to-moderate in exact boundaries. Earnings pressure, cash-flow deterioration and resistance agree. Missing synchronized peer valuations, a verified relative-strength series, current breadth/VIX readings, executable backlog and live options positioning prevent a high-confidence conclusion. ROIC and trailing earnings also require care because accounting effects distort comparisons.
Observe → Orient → Decide → Act
Observe: QCOM is roughly 35% below its high and testing its long-term moving-average area.
Orient: Diversification creates opportunity, while earnings and cash-flow pressure explain part of the discount.
Decide: Watch at the $169.64 snapshot. Current expected returns do not support aggressive buying.
Act: Consider a small starter at $155–$165 after checking for deterioration; add more selectively at $145–$155. Existing holders can hold a manageable position while monitoring execution. A rapid recovery above $190 calls for a fresh valuation and concentration review.
Cash is a position. Staggered purchases. No all-ins.
Don’t buy the dip. Buy the discount—and verify that the business still supports it.
Sources and methodology
Research and price snapshot dated November 13, 2026. Linked market pages can change after publication. Company figures are fiscal-period data; forecast EPS is an analyst estimate. Zones, scenario multiples, probabilities and actions are OBORDA judgments, not facts supplied by the sources.
- Qualcomm FY2026 Form 10-K: business, customers, financials and risks
- Qualcomm Q4 and FY2026 earnings release: results, outlook and capital returns
- Qualcomm Q4 earnings call: diversification and margin commentary
- Qualcomm: Apple patent license renewal, September 24, 2026
- Qualcomm: Samsung strategic partnership, announced July 27, 2022
- Qualcomm: Amazon data-center collaboration, September 8, 2026
- Stock Analysis: timestamped quote, statistics and cash-flow measures
- Stock Analysis: daily price and volume history
- Stock Analysis: historical valuation ratios
- TIKR: November 13 analyst estimate revisions
- Federal Reserve: October 28, 2026 policy statement
- Benzinga: November 13 technology selloff and Qualcomm
- MarketWatch: November 13 morning Treasury yields
For educational purposes. Investment outcomes are uncertain; zones are reassessed when price, fundamentals or market conditions change.