

OBORDA / OODA Investment Analysis • November 2, 2026
The iShares Semiconductor ETF (SOXX) is down about 27.5% from its reported 52-week high. With a 3-for-1 split approaching on November 5, the question isn’t whether the lower share price looks appealing. It’s whether the semiconductor businesses underneath SOXX offer an attractive balance of return and risk over the next six months.
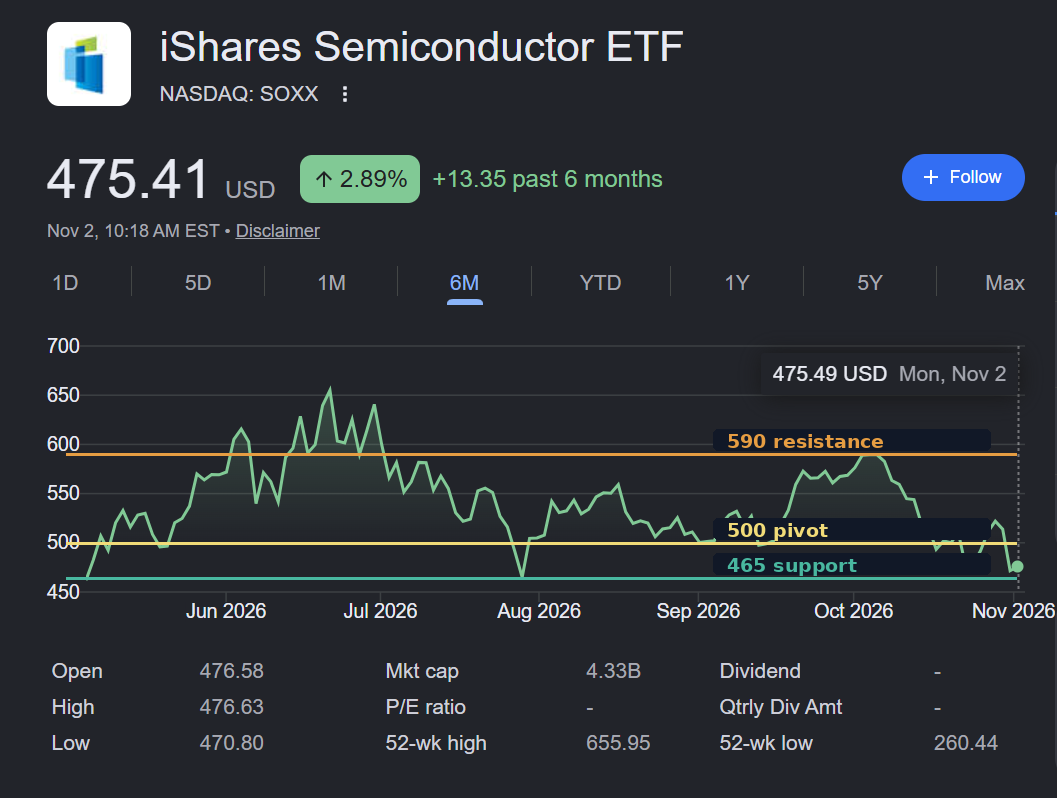
At $475.41 as of 10:18 a.m. EST on November 2 (the timestamp in my reference screenshot), SOXX has fallen substantially from its $655.95 reported 52-week high. I wanted to know what the fund owns, what could drive a recovery, and what could take prices lower.
What’s Under the Hood?
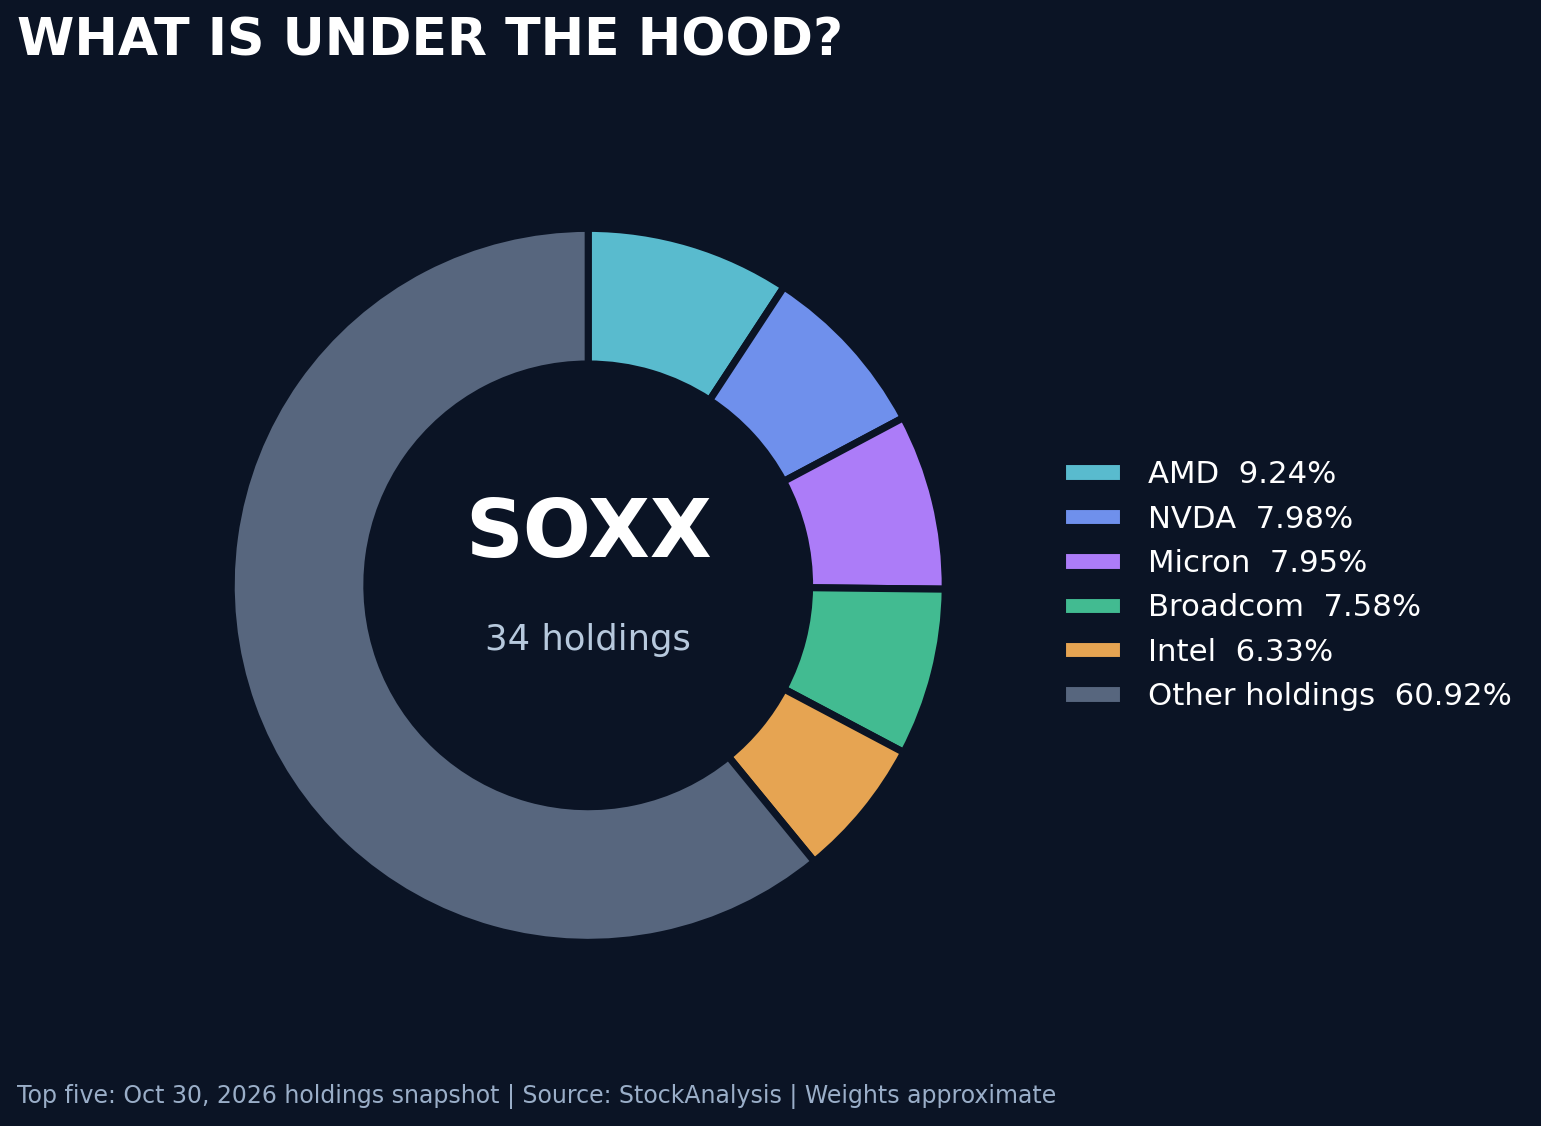
SOXX spreads exposure across AI computing, chip memory, networking, industrial semiconductors, and manufacturing equipment. Diversification across chip companies does not mean diversification away from the semiconductor cycle.
| Holding | Approx. weight | Why it matters |
|---|---|---|
| AMD | 9.24% | CPUs and AI accelerators |
| NVIDIA | 7.98% | AI computing platforms |
| Micron | 7.95% | DRAM, NAND and high-bandwidth memory |
| Broadcom | 7.58% | Custom AI chips and networking |
| Intel | 6.33% | Processors and manufacturing execution risk |
These leading holdings represent about 39% of the fund on the cited snapshot. The remaining investments include analog-chip producers, equipment makers and other semiconductor businesses. A decline in one company can matter, but a synchronized industry repricing matters much more.
The Technical Pattern: Failed Rallies and Support Tests
The six-month chart shows a summer peak near $656, followed by several recovery attempts that did not establish a lasting return to those highs. The October rebound approached $590 before the market reversed. On this snapshot, $500 is an important pivot and roughly $465–$475 is an area to watch for stabilization.
These are visual estimates from a six-month screenshot, not independently verified daily moving averages or volume-based support levels. A move back above $500 with better breadth would improve the technical picture. A decisive break below $465 would increase the risk of further downside.
The Industry Can Grow While Its Stocks Fall
AI investment, data-center networking, memory demand, consumer electronics, automotive systems and industrial automation all support the long-term demand case. Yet investors price expected future profits, not just sales growth. If capital spending rises faster than monetization, or earnings guidance disappoints, semiconductor multiples can contract even during a period of industry growth.
Fund valuation measures also differ substantially across providers and reporting methods. I therefore do not treat one reported ETF P/E as sufficient proof of a bargain. Updated, consistently measured forward earnings for the underlying holdings would strengthen this analysis.
The 3-for-1 Split: Accessibility, Not a Discount
The SEC-filed BlackRock supplement confirms a record date of November 3, distribution on November 4, and split-adjusted trading on November 5, 2026. At the reference price, $475.41 becomes approximately $158.47 per share and an existing one-share position becomes three shares. The economic value does not change because of the split.
Still, a lower whole-share purchase amount may encourage some investors to participate. That could improve attention and liquidity, but it does not automatically create durable new value for an ETF tracking underlying securities.
Seasonality, the Midterms, Rates and Geopolitics
Seasonality
Late-year and early-year semiconductor returns have often been favorable in historical studies, but seasonality is context rather than a reliable forecast. I give it limited weight compared with earnings and valuation.
November 3 midterm elections
Election outcomes could alter expectations for export controls, semiconductor industrial policy, taxation, energy and AI regulation. I do not assume one party’s victory guarantees semiconductor gains. The economic and company-specific consequences matter more than election-night headlines.
Interest rates
Semiconductor valuations are sensitive to yields and growth expectations. Lower rates combined with resilient demand would be constructive; lower rates caused by recession could be less helpful.
Geopolitical exposure
China-related export restrictions, Taiwan manufacturing concentration, and energy or shipping disruptions create nontrivial downside risks. These are particularly difficult to assign precise probabilities to—and could dominate normal technical patterns.
Four Possible Outcomes by May 2027
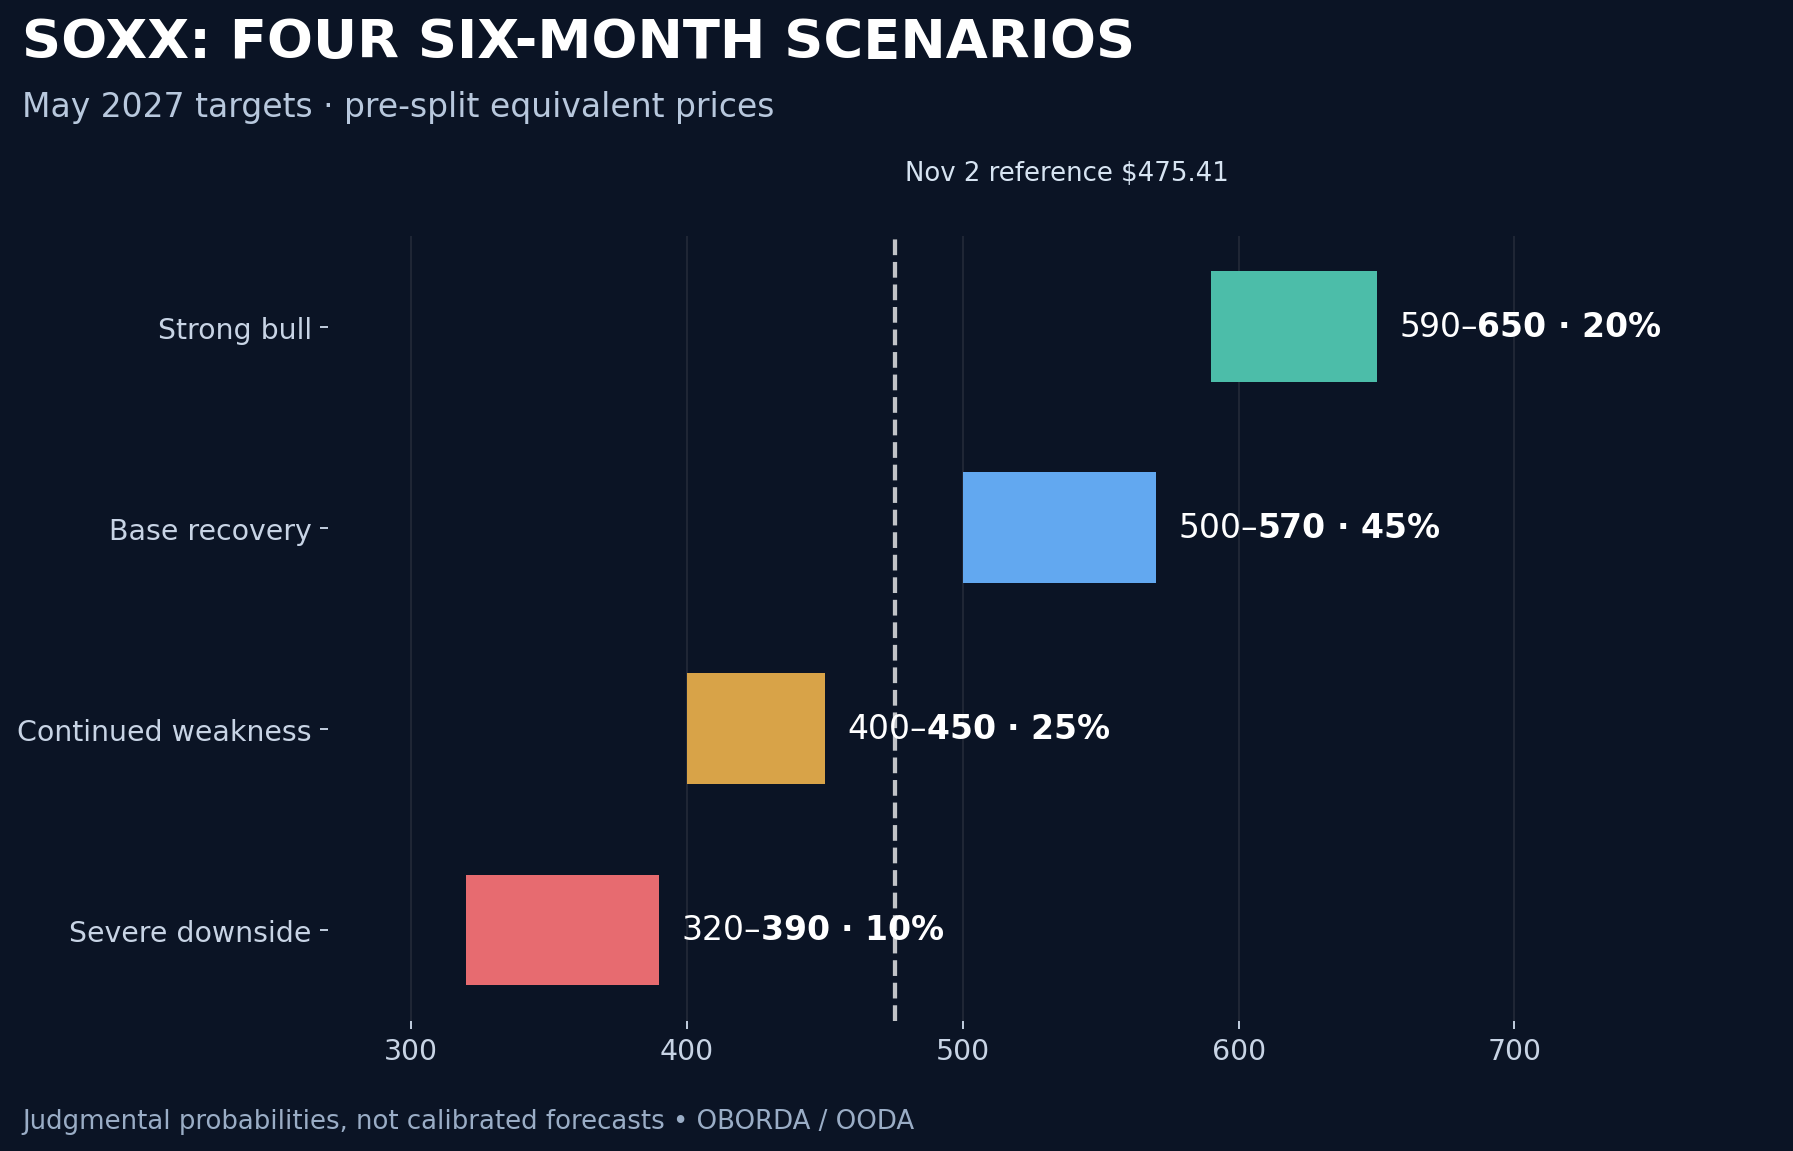
I built four judgmental scenarios. These are transparent assumptions, not backtested probabilities or statistical confidence intervals. Every target below is quoted in pre-split equivalent dollars to remain comparable with the November 2 screenshot.
| Scenario | Subjective probability | May 2027 price | Return vs. $475.41 |
|---|---|---|---|
| Strong bull recovery | 20% | $590–$650 | +24% to +37% |
| Base recovery | 45% | $500–$570 | +5% to +20% |
| Continued weakness | 25% | $400–$450 | −16% to −5% |
| Severe downside | 10% | $320–$390 | −33% to −18% |
The base case assumes semiconductor demand remains resilient and earnings expectations stabilize. The strong-bull case needs a meaningful improvement in guidance and investor confidence. The weakness cases reflect valuation compression, slower demand, or a disruptive macroeconomic or geopolitical event.
The probability-weighted midpoint is roughly $507 (+6.6%). That number is only a way of summarizing the chosen scenarios, not a measured expected return. The 65% combined probability assigned to the two positive scenarios is subjective.
My OODA Buy Zones
Ranges below are provisional and should be rechecked after earnings and new price information. A large decline does not automatically make a position high conviction.
| Classification | Pre-split equivalent | Post-split equivalent |
|---|---|---|
| 🔴 No New Buys / Consider Trim | Above $590 | Above $196.67 |
| 🟡 Watch | $500–$590 | $166.67–$196.67 |
| 🟢 Starter | $465–$500 | $155–$166.67 |
| 🟢🟢 Accumulation | $420–$465 | $140–$155 |
| 🔥 High Conviction candidate | $380–$420 | $126.67–$140 |
| ⚡ Exceptional / Reassess | Below $380 | Below $126.67 |
Why these levels? $590 is near the October recovery high; $500 is a repeated chart pivot; $465 is around the summer’s lower trading area. $420 and $380 represent progressively deeper discounts meant to compensate for risk—not verified technical support. A broken fundamental thesis overrides every buying zone.
OODA: Observe → Orient → Decide → Act
Observe: SOXX has corrected about 27.5% from its reported high; a split is imminent; semiconductor demand and investor expectations are diverging.
Orient: The fund owns both AI leaders and cyclical companies. Earnings quality, valuation, rates and geopolitics matter more than the split alone.
Decide: Recovery looks plausible over six months, but evidence does not yet establish exceptional value.
Act: Watch whether SOXX stabilizes near support and whether earnings expectations improve. A starter may be reasonable for investors accepting volatility; deeper accumulation requires either better prices or improved confirmation.
Confidence: Moderate in long-term chip demand; low-to-moderate in six-month price targets. All analysis is dated November 2, 2026, and is not personalized investment advice.