


OKTA stock analysis | OBORDA / OODA Investment Engine
When you sign into work, open an online account, or allow an AI assistant to use a business application, someone has to check your identity and decide what you can access. That is the problem Okta helps solve. Its software acts like a digital front desk: verify the visitor, check the permissions, and keep a record of access.
Okta was founded in 2009 by Todd McKinnon and Frederic Kerrest. It began trading on Nasdaq in April 2017 and completed its Auth0 acquisition in May 2021. Okta brings enterprise access controls; Auth0 gives developers tools for building secure customer sign-ins.
Sources: Okta: company history and identity platforms; Okta: investor FAQs and IPO history; Okta: Auth0 acquisition completed May 3, 2021.
Today, the opportunity extends to AI agents—software that can take actions for people. An agent needs permission to read a file or use an application, just as an employee does. More identities can mean more demand for access controls. It does not automatically mean faster growth or an attractive stock price.
The question for this OKTA stock analysis is straightforward: does the price leave enough room for things to go less well than investors expect?
OKTA price snapshot: a rebound, with expectations attached
Research date: November 19, 2026, America/New_York. Reference quote: $202.10 at 9:21 a.m. ET, premarket. Completed-session technicals end November 18. This is a research snapshot, not a live quote.
| Measure | Verified snapshot |
|---|---|
| Premarket reference | $202.10; November 19, 9:21 a.m. ET |
| Last regular-session close | $195.61; November 18, 4:00 p.m. ET; +12.07% |
| 52-week high / low | $235.00 / $62.66 |
| Correction at reference price | −14.00% |
| Correction at last close | −16.76% |
| Market classification | Mixed/rotational, with defensive pressure |
| Sector / industry | Information technology / identity security and cybersecurity software |
Correction calculation: ($202.10 − $235.00) ÷ $235.00 × 100 = −14.00%. A correction gets my attention; it does not establish value.
Sources: Stock Analysis: OKTA price history and timestamped quote; Yahoo Finance: OKTA range and last close.
Cybersecurity ETF CIBR gained 4.72% on November 18, while OKTA gained 12.07%. The stock outperformed its group that day. This was a sector rally, not newly released Okta earnings. One strong session also does not establish a lasting trend.
Sources: Stock Analysis: CIBR daily performance.
Palo Alto Networks reported 39% revenue growth and 35% backlog growth after the November 18 close, and raised its outlook. That supports the next morning’s sector optimism; it cannot explain trading that preceded the release. Acquisition activity also limits direct comparison with Okta’s growth.
Sources: Palo Alto Networks: Q1 FY2027 results, November 18.
Do the recent U.S. outages change the investment case?
They matter to sentiment and to the discussion about resilient infrastructure. The evidence does not establish that Okta caused these outages or that the outages have generated new Okta revenue.
| Event | Evidence and response | Relevance to OKTA |
|---|---|---|
| FAA ground stop, November 13 | The FAA described unstable legacy equipment and excessive network traffic during an investigation involving its network provider. It reported no indication of a cyberattack. | Infrastructure reliability issue; no verified Okta role. |
| Microsoft 365 disruption, November 12 | Reported explanations pointed to a technical problem. Officials said there was no evidence linking the recent outages to cyberattacks. | Raises reliability concerns; does not prove an identity-security failure. |
| Other November disruptions | Chase cited a software bug; Apple cited an internal update; the NSA described maintenance-related degradation. Marriott and United said their disruptions were not cybersecurity-related. | Different events require separate explanations. A shared headline is not a shared cause. |
| October DHS directory disclosure | Reporting linked the released records to DHS’s use of an Okta service. Okta said it had no evidence its own systems or data were compromised; the claimed access route remained unconfirmed. | A reputational risk to monitor, not proof of a confirmed Okta platform breach. |
| Okta’s November 6 threat advisory | Okta observed identity-focused attacks across multiple providers, without observed exploitation of a platform-specific vulnerability. | Supports the need for identity controls while highlighting the continuing attack risk. |
Sources: FAA: nationwide ground-stop questions and answers, November 15; ABC News: outage causes and company responses, November 18; MeriTalk: DHS incident and Okta response, October 30; Okta Threat Intelligence: AI-assisted identity attacks, November 6.
My interpretation: anxiety can move security stocks before customers sign contracts. A failed router, a software update, stolen credentials, and a vendor breach require different remedies. Okta can help control access; it cannot fix every type of outage.
For a separate look at the FAA contractor exposure, see OBORDA’s L3Harris FAA assessment.
The business is improving. How much improvement is priced in?
Okta sells recurring subscriptions. Single sign-on lets employees access several applications through one sign-in. Multi-factor authentication requires additional proof of identity. Auth0 helps developers build customer authentication, while governance tools help decide who should retain access.
The potential advantage is independence across technology providers and the effort required to replace embedded access workflows. Microsoft is the principal competitor; bundled products can put pressure on pricing. Current independent market-share gains and stronger pricing power were not verified.
Sources: SEC: Okta FY2026 Form 10-K, business and risk factors.
Okta expanded its AWS collaboration on November 5, including co-selling and AI-agent security work. Existing and planned integrations can broaden distribution, but the announcement did not quantify a revenue contribution. Treat monetization as a catalyst to test.
Sources: Okta: expanded AWS collaboration, November 5, 2026.
| Measure | Result |
|---|---|
| Revenue | $805 million; +11% year over year |
| Subscription revenue | $793 million; +12% |
| Contracted backlog / current backlog | $4.858 billion / $2.585 billion; +17% / +14% |
| GAAP / adjusted operating margin | 13% / 28% |
| Adjusted earnings per share | $1.05 versus $0.91 |
| Free cash flow | $227 million versus $162 million |
Backlog means contracted revenue not yet recognized. Free cash flow is operating cash left after capital spending under the company’s definition. GAAP uses standard accounting rules; adjusted figures exclude certain expenses and should be read alongside GAAP results.
Sources: Okta: Q2 FY2027 results and guidance, August 26, 2026.
Net retention was 107%: the measured existing-customer base expanded its annual contract value after churn and reductions. Customers above $100,000 in annual contract value rose to 5,255 from 4,945. Gross margin was approximately 80%. These suggest progress, with measured rather than explosive expansion.
The July balance sheet held approximately $2.3 billion of cash and short-term investments after repayment of the remaining convertible notes. Buyback capacity was $555 million; future purchases remain discretionary.
Sources: SEC: Okta Form 10-Q, quarter ended July 31, 2026.
Software requires relatively little physical capital: vendor data show about $8 million of trailing capital expenditure. However, trailing stock compensation of about $503 million was substantial alongside $979 million of free cash flow. Share awards are an economic cost even when they do not immediately consume cash.
Sources: Stock Analysis: trailing cash flow and stock compensation.
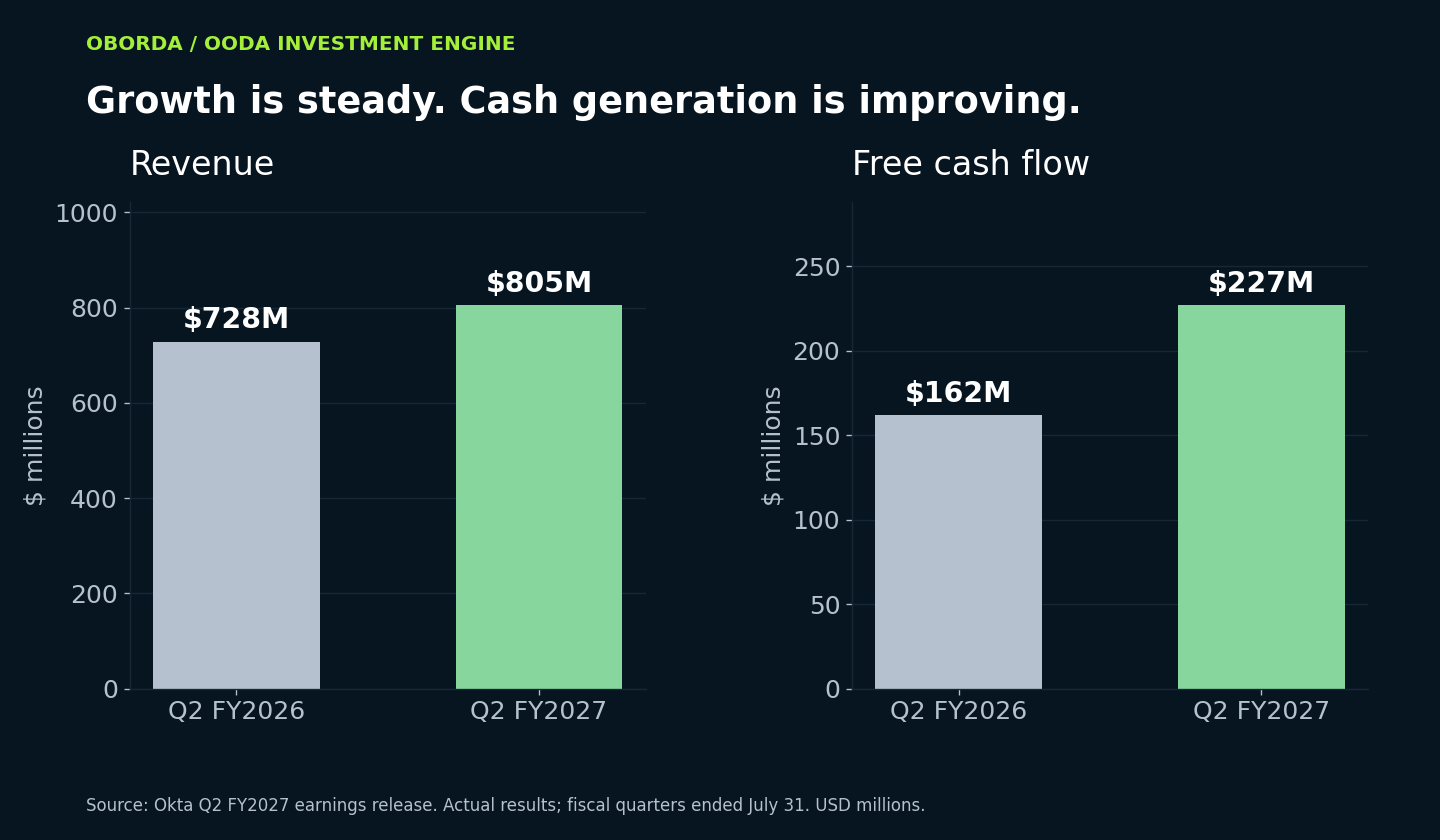
Earnings and guidance: December 1 is the next test
| Period | Revenue | Adjusted EPS | Free cash flow |
|---|---|---|---|
| Q3 FY2027 | $813–$817 million | $0.92–$0.94 | $175–$185 million |
| FY2027 | $3.216–$3.226 billion | $3.90–$3.94 | $910–$930 million |
FY2027 ends January 31, 2027. The full-year revenue midpoint rose from $3.195 billion to $3.221 billion, about 0.8%. Moving more services work to partners reduces reported revenue growth by about one percentage point. Guidance still calls for roughly 10%–11% revenue growth.
Sources: Okta: Q2 FY2027 results and guidance, August 26, 2026; SEC: prior Q1 FY2027 earnings release.
Q3 ended October 31, but its results are not yet public. Okta reports after the close on December 1, with its webcast at 5:00 p.m. ET. I will watch backlog growth, renewals, AI-related demand, margins, and the next guidance revision.
Sources: Okta: December 1 earnings announcement.
The August results were well received: shares rose about 28.6% on August 27. Strong results can justify optimism, but that reaction also increased the expectations built into the stock.
Sources: Quiver Quantitative: August earnings gap and prior trading.
Technicals: the rebound has resistance to clear
| Indicator | Reading / implication |
|---|---|
| 20-day simple moving average | $193.53; calculated from 20 closes |
| 50-day simple moving average | $198.85; calculated from 50 closes |
| 200-day simple moving average | $130.52; vendor-reported |
| 14-day RSI | 52.38; neutral momentum, vendor-reported |
| Recent support | $174–$180, then $164–$167 |
| Overhead supply | $199–$212, then roughly $220–$235 |
A moving average smooths prices. RSI measures recent momentum. Support is an area buyers previously defended; resistance is an area selling may return. Neither is a guarantee.
The last close regained the 20-day average but remained below the 50-day. Premarket trading suggests a reclaim; a completed session must confirm it. Yesterday’s approximately 5.29 million shares were only 1.07 times the 20-day average, which is inflated by the index-related November 3 volume spike.
Sources: Stock Analysis: OKTA price history and timestamped quote; Stock Analysis: OKTA technical and financial statistics.
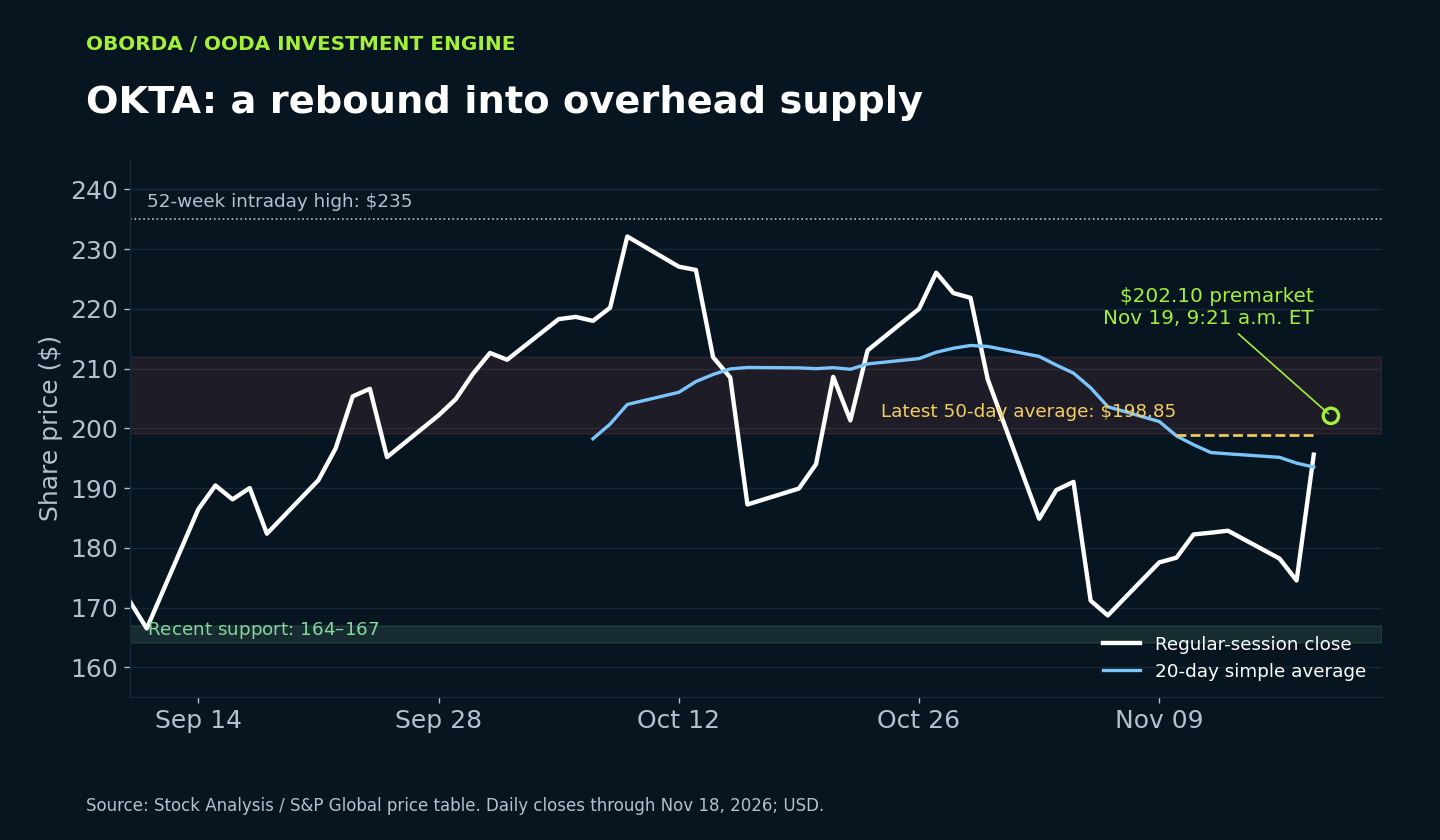
October’s failed advance left overhead supply. The August earnings gap between about $138 and $156.50 is a thinly traded downside region. The earlier $128–$135 base and trading around $145 help frame lower zones, but do not guarantee a floor.
Sources: Quiver Quantitative: August earnings gap and prior trading.
Market conditions: a strong group inside a mixed market
The S&P 500 had declined for five sessions through November 18 and was down about 3.1% for the week; Nasdaq was down 2.8%. Nasdaq’s small daily gain alongside a falling Dow showed rotation. VIX, a measure of expected stock-market volatility, closed around 24.56.
Sources: Associated Press: November 18 market close; WiseView: November 18 VIX and market-close snapshot.
The Fed’s latest policy range was 3.75%–4.00%. The 10-year Treasury yield was about 5.07% on November 18. October headline and core inflation rose 0.4% and 0.3% month over month. Higher bond yields increase the competition for investment dollars and can reduce the premium investors pay for software growth.
Sources: Federal Reserve: October 28 policy statement; U.S. Treasury: November 18 yield snapshot; BLS: October 2026 Consumer Price Index.
Classification: mixed/rotational, with defensive pressure. Cybersecurity buying helps explain OKTA’s rebound; broader market weakness helps explain part of the preceding pressure. The evidence cannot assign every move to one cause.
Holiday liquidity, year-end positioning, and tax-related trading can amplify volatility. No verified OKTA-specific seasonal return study was available, so seasonality adds no numerical premium to these zones.
Flows: separate index buying from lasting business demand
S&P 500 inclusion took effect November 4. That event can explain unusual rebalancing activity; it is already completed. Short interest at the October 30 settlement was about 6.59 million shares, roughly 4% of float and down 5.3% from the prior report. This does not support automatically blaming the decline on growing short positions.
Sources: S&P Dow Jones Indices: Okta inclusion effective November 4; MarketBeat: October 30 short-interest settlement.
A reviewed CEO filing identified prearranged trading, which is insufficient evidence of a new discretionary bearish view. Institutional holdings are delayed snapshots; current aggregate buying, options-dealer positioning, and subsequent buyback execution were not verified. Profit-taking and rotation remain possible explanations, not established measurements.
Sources: SEC: CEO Form 4 identifying a prearranged trading plan.
OKTA valuation: paying up for future success
My model uses FY2027 guidance midpoints: $3.221 billion revenue, $3.92 adjusted earnings per share, and $920 million free cash flow. It assumes 184 million diluted shares, matching management’s guidance assumption and allowing for equity awards. That differs from basic shares used by many quote services.
| Measure | Calculated value |
|---|---|
| Price / guided adjusted earnings | 51.6× |
| Price / guided cash flow per diluted share | 40.4× |
| Guided free-cash-flow yield | 2.47% |
| Enterprise value / guided revenue | About 10.8×; diluted-share proxy |
For example, $920 million divided by 184 million shares is $5 of cash flow per share. Paying $202.10 means paying 40.4 times that annual cash flow. The enterprise-value estimate subtracts approximately $2.25 billion of net cash from the diluted equity-value proxy. That balance-sheet input is dated July 31.
These are original, guidance-based calculations, not quoted consensus ratios. They do not mix trailing cash flow with forward guidance. They also retain stock compensation’s dilution risk.
Sources: Okta: Q2 FY2027 results and guidance, August 26, 2026; Stock Analysis: OKTA technical and financial statistics.
Historical vendor snapshots show EV/sales around 4.4×–6.3× at the previous four fiscal year ends, versus about 10.4× trailing sales at yesterday’s close. Business quality has improved, but the market has also expanded its valuation substantially.
Vendor-calculated return on invested capital was about 4.6%; acquisition goodwill complicates interpretation. Current quote-service forward P/E was roughly 48× for OKTA, versus 78× for PANW and 168× for CRWD. Forecast periods, growth, and accounting differ. A peer discount alone is insufficient evidence of value.
Sources: Stock Analysis: historical OKTA valuation ratios; Stock Analysis: PANW valuation snapshot; Stock Analysis: CRWD valuation snapshot.
This is the same distinction discussed in A Good Company Isn’t Always a Good Buy: a sound business can still offer an unattractive entry price.
What could the stock be worth in 12–18 months?
The following are original OBORDA scenarios, not company guidance or analyst consensus. They use FY2028 revenue and cash-flow assumptions. Value equals revenue × free-cash-flow margin × cash-flow multiple ÷ 184 million diluted shares.
| Case | Revenue / FCF margin | P/FCF | Rounded value | Return from $202.10 |
|---|---|---|---|---|
| Bear | $3.50 billion / 25% | 26× | $125 | −38.1% |
| Base | $3.60 billion / 29% | 35× | $200 | −1.0% |
| Bull | $3.80 billion / 31% | 39× | $250 | +23.7% |
Revenue assumptions imply roughly 9%, 12%, and 18% growth from the FY2027 guidance midpoint. The base case still pays a premium for a profitable subscription business; the bull case requires better growth and investor enthusiasm to persist.
Illustrative weights of 25% bear, 50% base, and 25% bull produce $193.75 using the rounded scenario values, about 4.1% below the reference. Those weights are judgment calls, not measured probabilities. Losses can exceed the bear case.

Six OKTA buy zones—and why each boundary exists
The refreshed evidence supports retaining the six ranges from this assessment. They combine business quality, valuation, chart structure, and a mixed market. They are planning ranges, not automatic orders.
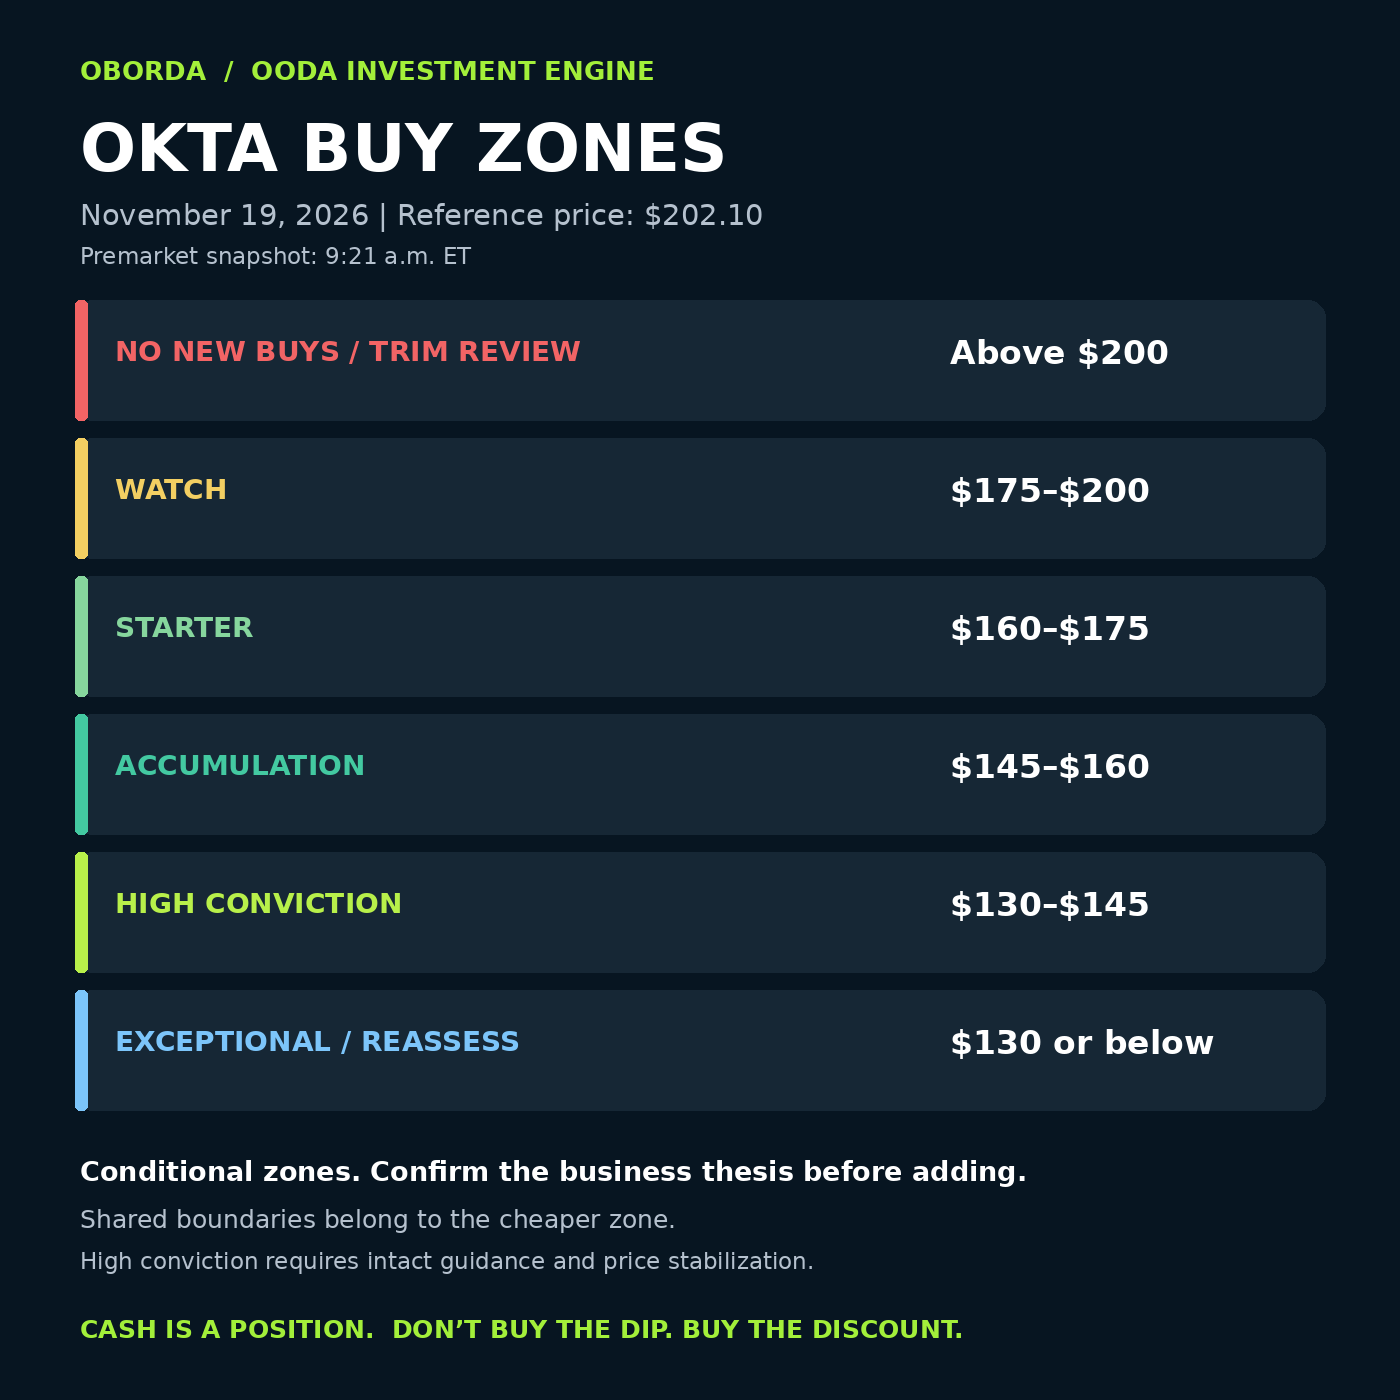
| Zone | Price region | Reason for the boundary |
|---|---|---|
| No New Buys / Trim Review | Above $200 | Near the 50-day reclaim and overhead supply. At $200, the model is about 51× guided adjusted EPS and 40× guided FCF. |
| Watch | $175–$200 | The $175 boundary references recent trading near $174–$180 and August’s $174.85 high. A better chart alone does not remove valuation risk. |
| Starter | $160–$175 | Brackets recent $164–$167 support and approaches the $156.50 earnings-day low. Guided P/FCF improves to about 32–35×. |
| Accumulation | $145–$160 | The $160 transition rounds a support region, not a precise floor. Around $145, earlier trading and roughly 29× guided FCF offer more valuation protection. |
| High Conviction | $130–$145 | The lower boundary approaches the $128–$135 base and $130.52 reported 200-day average. Guided P/FCF is about 26–29×. |
| Exceptional / Reassess | $130 or below | Entering or breaking the earlier base demands a fresh explanation. Cheapness cannot rescue a broken business thesis. |
Boundary rule: exactly $200 is Watch; $175 Starter; $160 Accumulation; $145 High Conviction; and $130 Exceptional / Reassess. In mathematical terms, each ordinary band excludes its lower endpoint and includes its upper endpoint.
At $175, the same weighted scenario value offers about 10.7% upside; at $160, about 21.1%. That supports small initial purchases before larger additions. The $145 boundary includes valuation judgment and historical trading context; it is not a verified stand-alone support floor.
For perspective, 5%, 10%, 15%, 20%, 25%, and 30% declines from $235 equal $223.25, $211.50, $199.75, $188, $176.25, and $164.50. These are reference marks, not the method used to create the zones.
What would invalidate this assessment?
- Persistent single-digit revenue or current-backlog growth while the valuation remains elevated.
- Net retention below 100%, indicating contraction in the measured existing-customer base.
- A material cash-flow outlook reduction without a credible explanation.
- A confirmed security failure causing meaningful customer losses, or sustained competitive pricing pressure.
- AI adoption failing to translate into durable per-share earnings and cash-flow growth.
A sustained break below about $164 weakens the chart; $130 or lower triggers a complete review. Price weakness alone does not establish business deterioration. Conversely, stronger verified growth and cash-flow guidance could justify raising the zones.
Confidence and research limits
Confidence: Moderate in the business assessment; moderate-to-low in precise zone boundaries. Reported profitability, recurring revenue, and chart references support the analysis. Unreleased Q3 results, unquantified AI monetization, dated balance-sheet inputs, and uncertain future valuation multiples limit confidence.
Full market breadth, real-time institutional flows, options positioning, a verified OKTA-specific seasonal study, current market-share changes, and independent pricing-power measurements were unavailable. The 20- and 50-day averages were recalculated; the 200-day average and RSI remain vendor figures. Conflicting indicators with unclear timeframes were excluded.
This is educational research, not a personalized allocation recommendation. No position size, cost basis, or portfolio concentration is assumed.
Sources and methodology
Sources were reviewed for this November 19 assessment. Financial periods, event dates, and quote times differ as identified above. Calculations, zone decisions, and scenarios are original analysis.
Open the source list
- Stock Analysis: OKTA price history and timestamped quote
- Yahoo Finance: OKTA range and last close
- Stock Analysis: OKTA technical and financial statistics
- Okta: Q2 FY2027 results and guidance, August 26, 2026
- SEC: prior Q1 FY2027 earnings release
- SEC: Okta Form 10-Q, quarter ended July 31, 2026
- SEC: Okta FY2026 Form 10-K, business and risk factors
- Okta: company history and identity platforms
- Okta: investor FAQs and IPO history
- Okta: Auth0 acquisition completed May 3, 2021
- Okta: expanded AWS collaboration, November 5, 2026
- FAA: nationwide ground-stop questions and answers, November 15
- ABC News: outage causes and company responses, November 18
- MeriTalk: DHS incident and Okta response, October 30
- Okta Threat Intelligence: AI-assisted identity attacks, November 6
- Palo Alto Networks: Q1 FY2027 results, November 18
- Stock Analysis: CIBR daily performance
- Associated Press: November 18 market close
- Federal Reserve: October 28 policy statement
- U.S. Treasury: November 18 yield snapshot
- BLS: October 2026 Consumer Price Index
- WiseView: November 18 VIX and market-close snapshot
- MarketBeat: October 30 short-interest settlement
- S&P Dow Jones Indices: Okta inclusion effective November 4
- SEC: CEO Form 4 identifying a prearranged trading plan
- Stock Analysis: historical OKTA valuation ratios
- Stock Analysis: trailing cash flow and stock compensation
- Stock Analysis: PANW valuation snapshot
- Stock Analysis: CRWD valuation snapshot
- Quiver Quantitative: August earnings gap and prior trading
- Okta: December 1 earnings announcement
The OODA strategy: observe, orient, decide, act
Observe: Okta’s reported profitability and backlog improved. Cybersecurity sentiment strengthened, while multiple U.S. outages reminded investors how dependent daily life is on working technology. The evidence does not establish an Okta role in those outages.
Orient: Identity security is valuable. At the $202.10 premarket snapshot, roughly 52× guided adjusted earnings and 40× guided cash flow leave limited room for disappointment.
Decide: I would keep new money in cash at this price. A modest existing position can be held while watching the thesis. A concentrated holding deserves trim review, especially into the $208–$212 and $220–$235 supply regions. A winner does not need to be sold simply because it rose.
Act: Watch $175–$200. Consider a small starter at $160–$175 only if the business outlook holds and selling stabilizes. Add through lower zones in stages after checking new information. Reassess every range after December 1 earnings; review any standing limit order before that event.
Cash is a position. Staggered purchases. No all-ins. Buy the discount, not just the dip.