


OBORDA / IPO Research
Anthropic builds Claude, an artificial intelligence system people and businesses use to write software, analyze information and complete work. Seven co-founders—Dario Amodei, Daniela Amodei, Tom Brown, Jack Clark, Jared Kaplan, Sam McCandlish and Christopher Olah—started the company in January 2021. Dario is CEO; Daniela is president and board chair. Its proposed public listing would give retail investors direct access to a business that sits between enterprise software and the enormous infrastructure spending behind AI. [S1]
I am applying principles associated with Warren Buffett: understand the business, assess its competitive advantage, examine management incentives and demand a margin of safety. This is my analysis; it does not imply that Buffett owns, recommends or endorses Anthropic.
Observe: What Investors Would Actually Own
Claude is both a family of models and a commercial platform. Customers interact through Claude Chat, coding tools such as Claude Code, work applications including Cowork, and an application programming interface, or API, that lets developers build Claude into their own products. Revenue comes from subscriptions and metered consumption. Buying shares would mean owning part of Anthropic, not an ownership interest in its customers or cloud partners. [S1] [S9]
Its relevance extends beyond a chatbot. Coding tools can change how software is built; enterprise integrations can put AI inside everyday workflows; cloud providers distribute the service; and training and running models creates demand for chips, memory, networking, power and data centers. Anthropic identifies consumption-based revenue as approximately 79% of nine-month 2026 revenue, with subscriptions accounting for the rest. [S1]
The relationship map is complicated. AWS supplies cloud capacity and Trainium chips and distributes Claude through Bedrock. Google supplies cloud services and TPUs and distributes Claude through its platform. Microsoft distributes Claude through Azure/Foundry, while NVIDIA supplies the GPU ecosystem. These companies can be suppliers, distributors, investors and competitors at the same time.
Google’s own models compete with Claude; Microsoft’s broader AI relationships create additional strategic conflicts. OpenAI and open-weight alternatives also compete for customer workloads. A commercial agreement does not, by itself, establish equity ownership. [S4] [S7] [S8]
Customer case studies include companies such as Ramp, Canva, GitLab, Intercom, Snowflake and Thomson Reuters. These establish examples of adoption, not the dollar value or profitability of each relationship. [S10]
The IPO: Proposed Terms, Not a Completed Transaction
The November 17 preliminary prospectus still says “subject to completion.” No final offering price or first trade was established in the sources reviewed. Nasdaq listing approval under ANT is disclosed. Reuters reports expected pricing on November 18 and trading on November 19, both in U.S. time; these remain expectations, not completed events. [S1] [S2] [S3]
| Item | Verified preliminary terms or calculation |
|---|---|
| Offering range | $70–$78 per Class A share |
| Public offering | 825,000,000 shares |
| New shares sold by Anthropic | 801,351,354 |
| Shares sold by existing holders | 23,648,646; proceeds go to those holders |
| Overallotment option | Up to 123,750,000 additional new shares; 30-day option |
| Underwriter representatives | Goldman Sachs and Morgan Stanley; broader syndicate listed in prospectus |
| Public offering gross value | $57.75–$64.35 billion; $61.05 billion at $74 |
| Primary gross proceeds | $56.09–$62.51 billion; $59.30 billion at $74 |
| Secondary gross proceeds | $1.66–$1.84 billion; $1.75 billion at $74 |
| Concurrent private placement | $26 billion, conditional; at the IPO price |
| Combined company gross proceeds at $74 | $85.30 billion, excluding selling holders and option |
| Estimated combined company net proceeds | $84.6 billion at $74; $93.7 billion with full option exercise |
Sources: November 17 prospectus, cover, The Offering, Underwriting and Use of Proceeds; Anthropic’s November 10 roadshow announcement. Gross amounts are OBORDA calculations. Final underwriting fee fields are not completed on the preliminary cover; estimated net proceeds include estimated fees and expenses. [S1] [S2]
The stated uses include compute and infrastructure, working capital, operating expenses, hiring and retention, and possible acquisitions or investments. Approximately $3.8 billion is earmarked for anticipated RSU-related tax withholding at the midpoint. That tax remittance is a real cash use even though stock compensation expense itself is generally noncash.
The IPO does not guarantee that the private placement closes: the latter depends on the IPO and additional conditions, while the IPO is not conditional on it. [S1]
Financial Progress—and What the Headline Loss Obscures
Figures below are in U.S. billions, except percentages. Full years end December 31; nine-month periods end September 30. Historical full-year statements are audited; interim figures are unaudited. [S1]
| Measure | FY2024 | FY2025 | 9M2025 | 9M2026 |
|---|---|---|---|---|
| Revenue | 0.386 | 4.585 | 2.545 | 33.242 |
| GAAP operating loss | (2.980) | (8.060) | (5.224) | (1.260) |
| Adjusted operating income/(loss) | (2.788) | (4.854) | (3.133) | 4.081 |
| GAAP net loss | (8.309) | (41.965) | (25.107) | (104.039) |
| Operating cash flow | (5.692) | (2.637) | (2.024) | 6.569 |
| Recognized stock compensation | 0.192 | 1.165 | 0.591 | 3.255 |
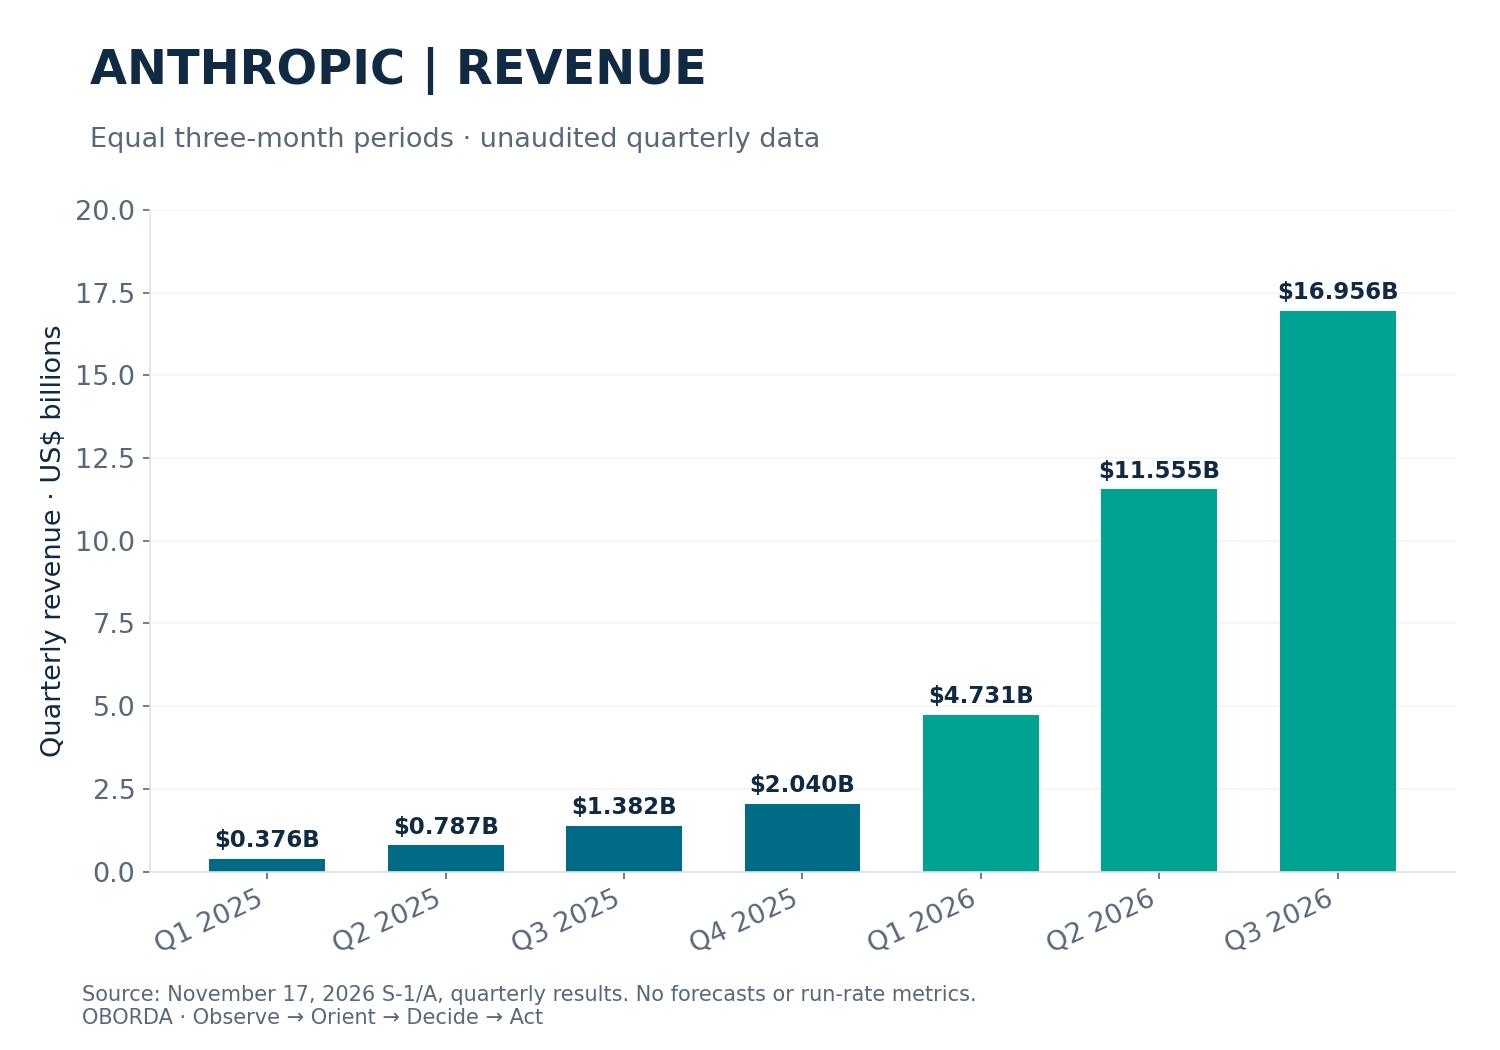
Nine-month revenue increased about 1,206% year over year. Q3 2026 revenue was $16.956 billion, up approximately 1,127% year over year and 46.7% sequentially. Sequential growth slowed from approximately 144.2% in Q2. Slower growth from a much larger base is different from shrinking sales, but the valuation must accommodate deceleration. These percentages are calculations from disclosed revenue. [S1]
The $104.039 billion nine-month net loss is not $104 billion of cash burned. It includes $94.324 billion of fair-value changes in convertible notes, derivative liabilities and SAFEs. A rise in company valuation can raise the accounting liability on financing instruments and create an expense. That helps explain the headline loss; it does not erase the economic claims held by those investors. Other losses and tax effects also remain. [S1]
Adjusted operating income excludes stock compensation, noncash charitable contributions and, where relevant, the Bartz settlement. The nine-month bridge is −$1.260B + $3.255B + $2.086B = $4.081B. Adjusted performance is useful for comparison, but I will not describe it as GAAP profit. Employee equity and charitable issuances can dilute shareholders even when excluded from an adjusted metric. [S1]
Cash and equivalents of approximately $95.6 billion, plus $36.3 billion of short-term investments, provide considerable liquidity at September 30. The $15 billion revolving facility had no drawn borrowings and $205 million of standby letters of credit.
Positive operating cash flow is encouraging, but working-capital timing and financing still matter. Operating cash flow less $925 million of equipment purchases is $5.644 billion; subtracting another $1.955 billion of leased-asset/equipment prepayments gives $3.689 billion. Those are analytical cash-flow views, not company guidance or a claim of sustainable distributable cash. [S1]
The other side is scale: the filing reports approximately $900.9 billion of purchase and lease commitments, including subsequent agreements; approximately $70.7 billion falls due in the twelve months after September 30, 2026, and $451.6 billion before the end of 2030.
These are future contractual obligations, substantially related to compute and infrastructure—not a $900.9 billion loan payable immediately. Do not simply subtract them all from today’s equity value or add individual partnership announcements on top of this aggregate. Their timing, cancellation terms, utilization and funding determine the risk. [S1]
Unrecognized compensation also matters: approximately $24.1 billion on certain unvested RSUs and $2.1 billion on other awards are disclosed, alongside IPO-triggered compensation effects. The filing changed expense presentation and does not provide a conventional gross-profit line in its current statements. I therefore do not invent a comparable software gross margin or a clean inference-only margin. [S1]
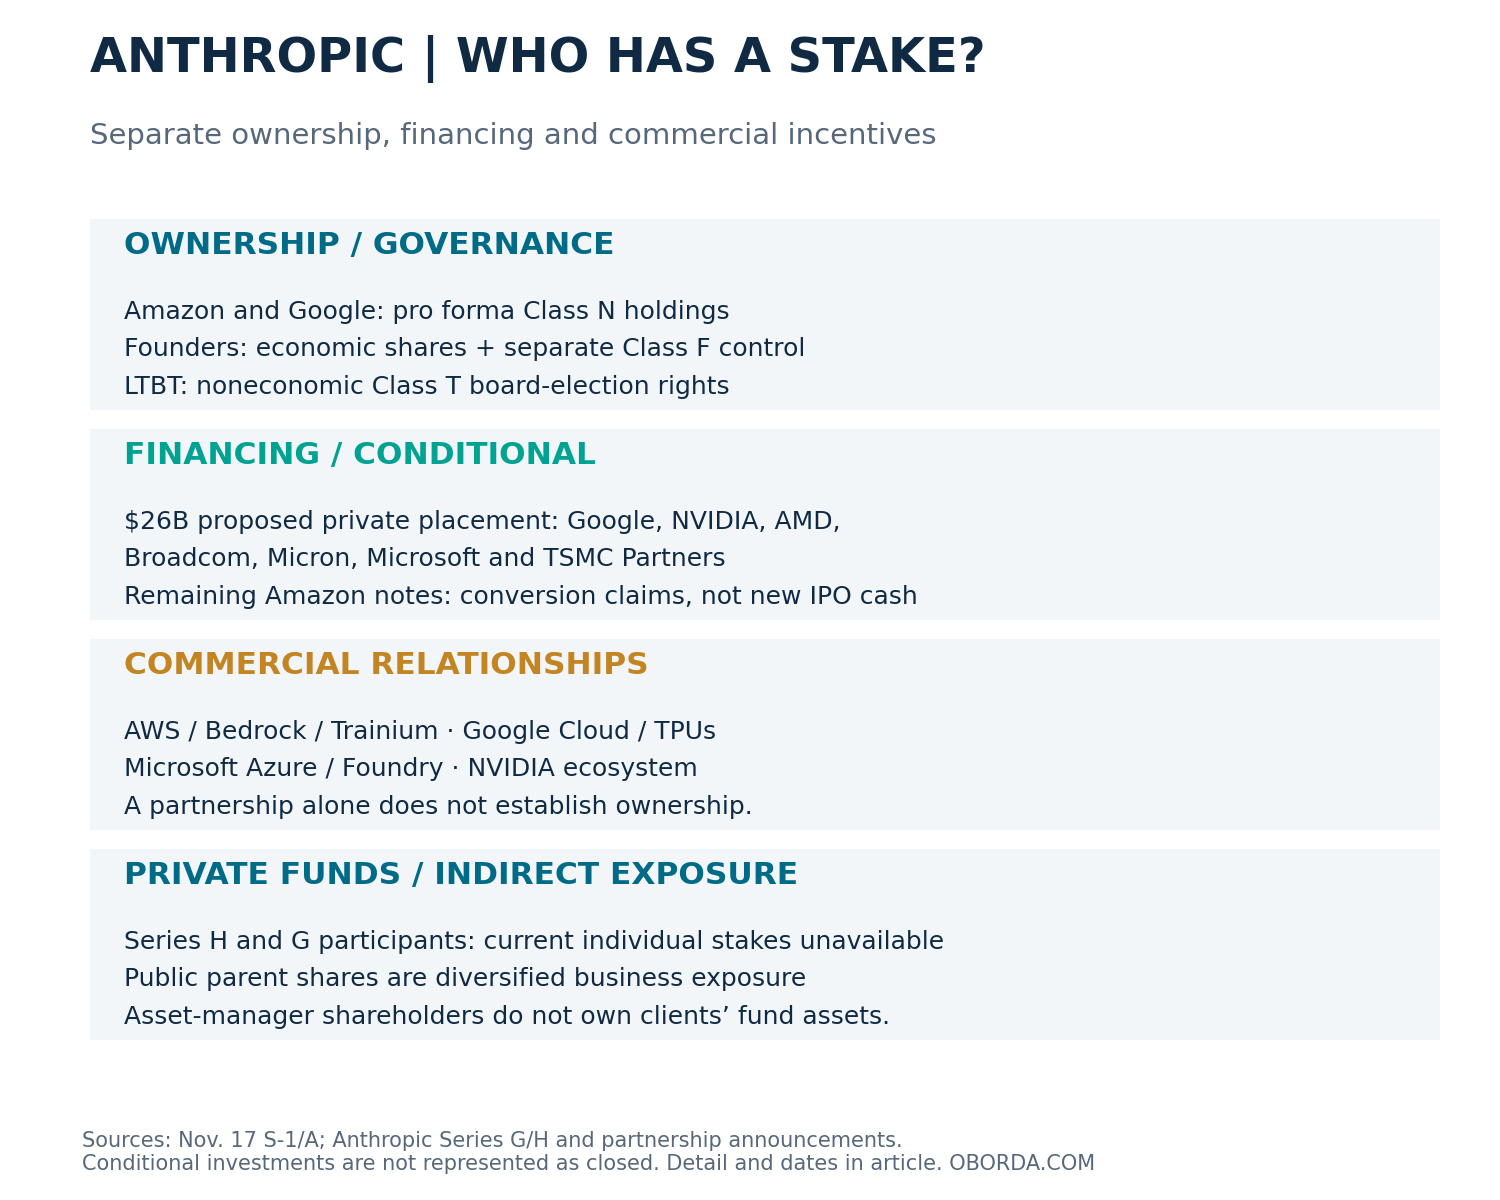
Who Has a Stake—and What Kind?
This is a relationship table, not a claim that every historical investor still holds its original position. “Pro forma” describes the filing’s assumed conversions and transaction completion, not a completed IPO.
Percentages below are economic calculations against the approximately 13.087 billion legally outstanding economic shares at the $74 midpoint, not voting percentages. [S1]
| Entity | Relationship | Verified stake or investment | Status/date | Why it matters |
|---|---|---|---|---|
| Amazon | Existing equity, remaining convertible financing, AWS supplier/distributor | 1.921B Class N shares pro forma after offering; about 14.7%; another 1.564B shares potentially issuable on remaining notes | Nov. 17 filing assumptions; conversion cap remains | Large economic exposure and infrastructure dependence; do not count remaining notes twice |
| Google/Alphabet | Existing equity, financing, cloud/distribution and model competitor | 1.654B Class N before transaction; 1.790B after proposed $10B placement; about 13.7% after | Conditional transaction; Nov. 17 filing | Supplier and competitor incentives coexist |
| NVIDIA | Previously announced strategic financing and hardware collaboration; new placement | Proposed $10B IPO-price purchase; earlier announcement: up to $10B commitment, part included in Series G | New placement unclosed; earlier commitments are not all additive | Chip demand and investment returns can motivate participation |
| Microsoft | Prior strategic financing and Azure relationship; new placement | Proposed $1B purchase; earlier announcement: up to $5B commitment, part included in Series G | New placement unclosed | Commercial value extends beyond share-price returns |
| AMD | Hardware agreement and placement | Proposed $2.5B purchase, satisfying part of its hardware-agreement investment commitment | Conditional | Avoid counting the same commitment as two investments |
| Broadcom; Micron; TSMC Partners | Strategic placement purchasers | Proposed $1B; $1B; $0.5B respectively | Conditional | Supply-chain interests; aggregate placement remains $26B |
| Altimeter; Dragoneer; Greenoaks; Sequoia | Series H lead investors | $65B round collectively; $965B post-money valuation; individual current percentages not established here | May 28, 2026 announcement | Different purchase terms and entry prices from IPO buyers |
| Capital Group; Coatue; D1; GIC; ICONIQ; XN | Series H co-leads | Individual amounts and current percentages unavailable in reviewed disclosure | May 28, 2026 | Institutional backing is evidence of financing access, not fair value |
| Fidelity; Blackstone; Lightspeed; Temasek; T. Rowe Price entities; others | Disclosed Series H participants | Individual current stakes unavailable | May 28, 2026 | Fund-level exposure differs from owning the asset manager’s stock |
| BlackRock-affiliated funds; Menlo; General Catalyst; QIA; others | Disclosed Series G participants | $30B round collectively at $380B post-money; individual current stakes unavailable | Feb. 12, 2026 | Historical participation does not establish today’s holding size |
| Founders / Founder LLC | Economic holdings and special voting control | Dario: 237.260M Class A after proposed sale, excluding proxy shares; Daniela: 238.031M; Founder LLC: one Class F share with 50.1% general voting power | Pro forma Nov. 17 filing | Economic ownership and control are different measures |
| Long-Term Benefit Trust | Governance rather than ordinary economic ownership | One noneconomic Class T share; generally elects/removes a board majority | Nov. 17 structure | Public shareholders do not control the board |
| Salesforce/Snowflake and implementation partners | Product/distribution relationships; Salesforce Ventures also participated historically | No current ownership percentage inferred from partnerships | Company disclosures | Commercial reach must be separated from a cap table |
Sources: S1, Principal and Selling Stockholders, The Offering and Concurrent Private Placement; S4–S8; historical Salesforce Ventures participation: S16. Placement amounts total $26B: $10B + $10B + $2.5B + $1B + $1B + $1B + $0.5B. [S1] [S4] [S5] [S6] [S7] [S8] [S16]
Amazon’s April announcement described $5 billion of new investment with up to $20 billion more in the future, on top of the earlier $8 billion. The subsequent Series H announcement includes $5 billion from Amazon. These announcements overlap: do not add every headline as if it were separate cash received. The latest filing’s shares and remaining financing provide the more relevant IPO reconciliation. [S4] [S5]
Indirect exposure through Amazon, Alphabet or another public investor is diluted by the rest of that company’s business. Buying an asset manager does not give a shareholder a proportional claim on investments held in its clients’ funds. A specific fund’s actual holdings, valuation dates, fees and position limits must be checked before treating it as Anthropic exposure.
Early investors may have preferred rights, lower entry costs, diversification needs and fund-distribution deadlines. Strategic investors can benefit from infrastructure sales. Employees may want liquidity for taxes or life expenses. These incentives differ from those of a retail investor buying common shares at the opening price. None establishes a margin of safety for me.
Share Counts: The Valuation Trap
At $74, the reconciliation is as follows. Figures are billions of shares, rounded; the calculations use unrounded values. [S1], pages 23–27.
| Definition | Shares | What it includes |
|---|---|---|
| Legal economic shares, post-offering | 13.086673 | 7.427992B Class A + 5.658681B Class N; includes benefit-fund subsidiary shares |
| Accounting economic shares, point-in-time model | 12.239832 | Legal economic shares less 0.846841B held by wholly owned benefit-fund subsidiary |
| Filing’s broader diluted model | 18.012993 | Legal shares plus remaining notes, awards, matching obligations and specified later issuances; treasury-stock adjustment |
Class F and Class T add two legal shares but no economic rights; Class E has no issued shares in the offering assumptions. Historical weighted-average EPS shares are different again and are unsuitable for multiplying an IPO price into a post-IPO market value.
The diluted bridge is:
13.086673B + 1.774343B options − 0.069775B treasury-stock adjustment + 1.026660B remaining September RSUs + 0.047041B later RSUs + 1.563617B remaining Amazon-note conversion shares + 0.001411B acquisition issuances + 0.001590B holdback + 0.027992B matching issuance + 0.553441B vested matching obligation = 18.012993B.
The initial 0.846841B benefit-fund shares are already in the legal base: they are not added again. Preferred conversion, 0.276828B shares from notes converting at IPO, and net IPO RSU settlement are also already reflected in that base.
The remaining Amazon notes are included once in the diluted model; I do not then subtract their full accounting liability again as debt from the same modeled equity value. Unallocated equity-plan reserves are future capacity, not currently outstanding awards, and are excluded. This diluted model is not GAAP diluted EPS and is not a forecast that every instrument will settle immediately. [S1]
At $74, legal economic equity value is approximately $968.4B; the accounting-share view is $905.7B; the broader diluted equity value is $1,332.96B. Comparing one of these with a private-round valuation requires matching definitions and rights.
Governance: The Mission and the Minority Shareholder
Anthropic is a Delaware public benefit corporation. Directors balance stockholder financial interests, affected stakeholders and its stated public benefit. Founder LLC’s Class F voting power remains 50.1% despite future ordinary share issuance, while the LTBT has separate board-election powers.
Class N is generally nonvoting and generally converts to Class A on qualifying third-party transfers. Class A receives one vote per share, but minority investors cannot assume conventional control rights. [S1] [S11]
The benefit-fund framework permits discretionary additional issuances linked to 50% share-price milestones, with up to 2% issuance under the disclosed framework at each milestone. Employee donation matching and compensation create further potential dilution.
These obligations may support a mission investors value, but they are economic terms to underwrite, not decorative language. Founder philanthropy pledges do not give public holders control over those decisions. [S1]
I want management to preserve both product quality and returns on incremental capital. At this stage, founder control and long-term research can support patient execution, but public shareholders have limited ways to change course. I would size that governance risk explicitly.
Orient: Is There a Durable Competitive Advantage?
My strongest argument for the business is that useful AI can become embedded in expensive, important workflows. Evaluation work, permissions, compliance reviews, integrations and employee habits can make switching inconvenient. Broad distribution and access to capital can reinforce that advantage.
The company reports more than 11,900 customers generating at least $100,000 of trailing-twelve-month revenue and approximately 900% net revenue retention at September 30. Its retention definition compares revenue from qualifying existing customers across corresponding quarters and excludes Pro, Max and Ultra subscriptions.
It is not a 900% customer-retention rate or a reasonable perpetual growth assumption. [S1] [S9]
The counterargument is equally important: customers can use several models, competitors can improve rapidly, and lower-cost alternatives can reset pricing. Workflow attachment is more defensible than a temporary benchmark lead. I would look for persistent customer value, dependable performance and improving unit economics across several model generations.
Customer concentration is material: the top five represented about 25% of nine-month revenue, although no single customer exceeded 10%. Some large accounts can reduce spending without long contractual protection. High usage today is not the same as guaranteed future sales. [S1]
Compute economics are the central test. Falling cost per task helps only if price cuts, competitive spending, training costs and unused capacity do not absorb the benefit. More usage can improve economics—or magnify an expensive service.
The path to durable cash generation requires revenue to outgrow the full cost of serving customers, ongoing research, personnel, equipment replacement, commitments and dilution. I would not assume mature software margins.
Market conditions also matter. Reuters’ November 17 market report describes battered technology stocks stabilizing ahead of NVIDIA results and this IPO. I treat it as a dated sentiment snapshot. Higher required returns can compress AI valuations regardless of product adoption.
I have not verified IPO demand books, live fund flows, dealer positioning or borrow availability; I assign no timing edge from them. [S3]
Valuation: An Exciting Business Can Still Be an Expensive Stock
I use equity value divided by revenue, not enterprise value/revenue, earnings multiples or a discounted-cash-flow appraisal. No cash is added to these equity-multiple valuations. Remaining notes are modeled as equity conversion. The denominator matters:
- TTM revenue: $35.282B = FY2025 $4.585B − 9M2025 $2.545B + 9M2026 $33.242B.
- Annualized Q3 revenue: $67.824B = $16.956B × 4. This is a sensitivity anchor, not trailing revenue or a forecast.
- October 31 run-rate metric: approximately $81B. The company annualizes trailing-28-day consumption fees and current monthly subscriptions. It is neither GAAP annual revenue nor contracted backlog. [S1]
| Price / circumstance | Diluted equity value | / TTM revenue | / Annualized Q3 revenue |
|---|---|---|---|
| $70 proposed low | $1,262.0B | 35.8× | 18.6× |
| $74 midpoint | $1,333.0B | 37.8× | 19.7× |
| $78 proposed high | $1,403.9B | 39.8× | 20.7× |
| $90 hypothetical opening | $1,621.2B | 45.9× | 23.9× |
| $110 hypothetical opening | $1,981.4B | 56.2× | 29.2× |
| $130 hypothetical opening | $2,341.7B | 66.4× | 34.5× |
Calculations: offering rows adjust the fixed $26B placement share count and option treasury-stock adjustment for each IPO price. Opening examples assume final pricing at $74, no option exercise and 18.012993B diluted shares fixed thereafter.
A higher trading price does not deliver more IPO cash to the company. At $74, value divided by the $81B run-rate metric is about 16.5×; that lower number does not make it a trailing-sales multiple.
For perspective, a hypothetical 10% annual return from $74 over five years requires about $119.18 a share. At an assumed 20B future diluted shares, that means approximately $2.38 trillion of equity value.
At 30 times free cash flow, it requires approximately $79.5B of annual free cash flow; at a 25% cash margin, approximately $318B of revenue. Those are my reverse-valuation assumptions, not management forecasts. A lower terminal multiple or greater dilution raises the operating hurdle.
Even doubling revenue does not guarantee a gain. If a 20× sales valuation falls to 10× while revenue doubles, equity value is unchanged; 10% more shares would then reduce value per share by about 9.1%. That is why I assess the stock price separately from the growth story.
Six Provisional Valuation Zones
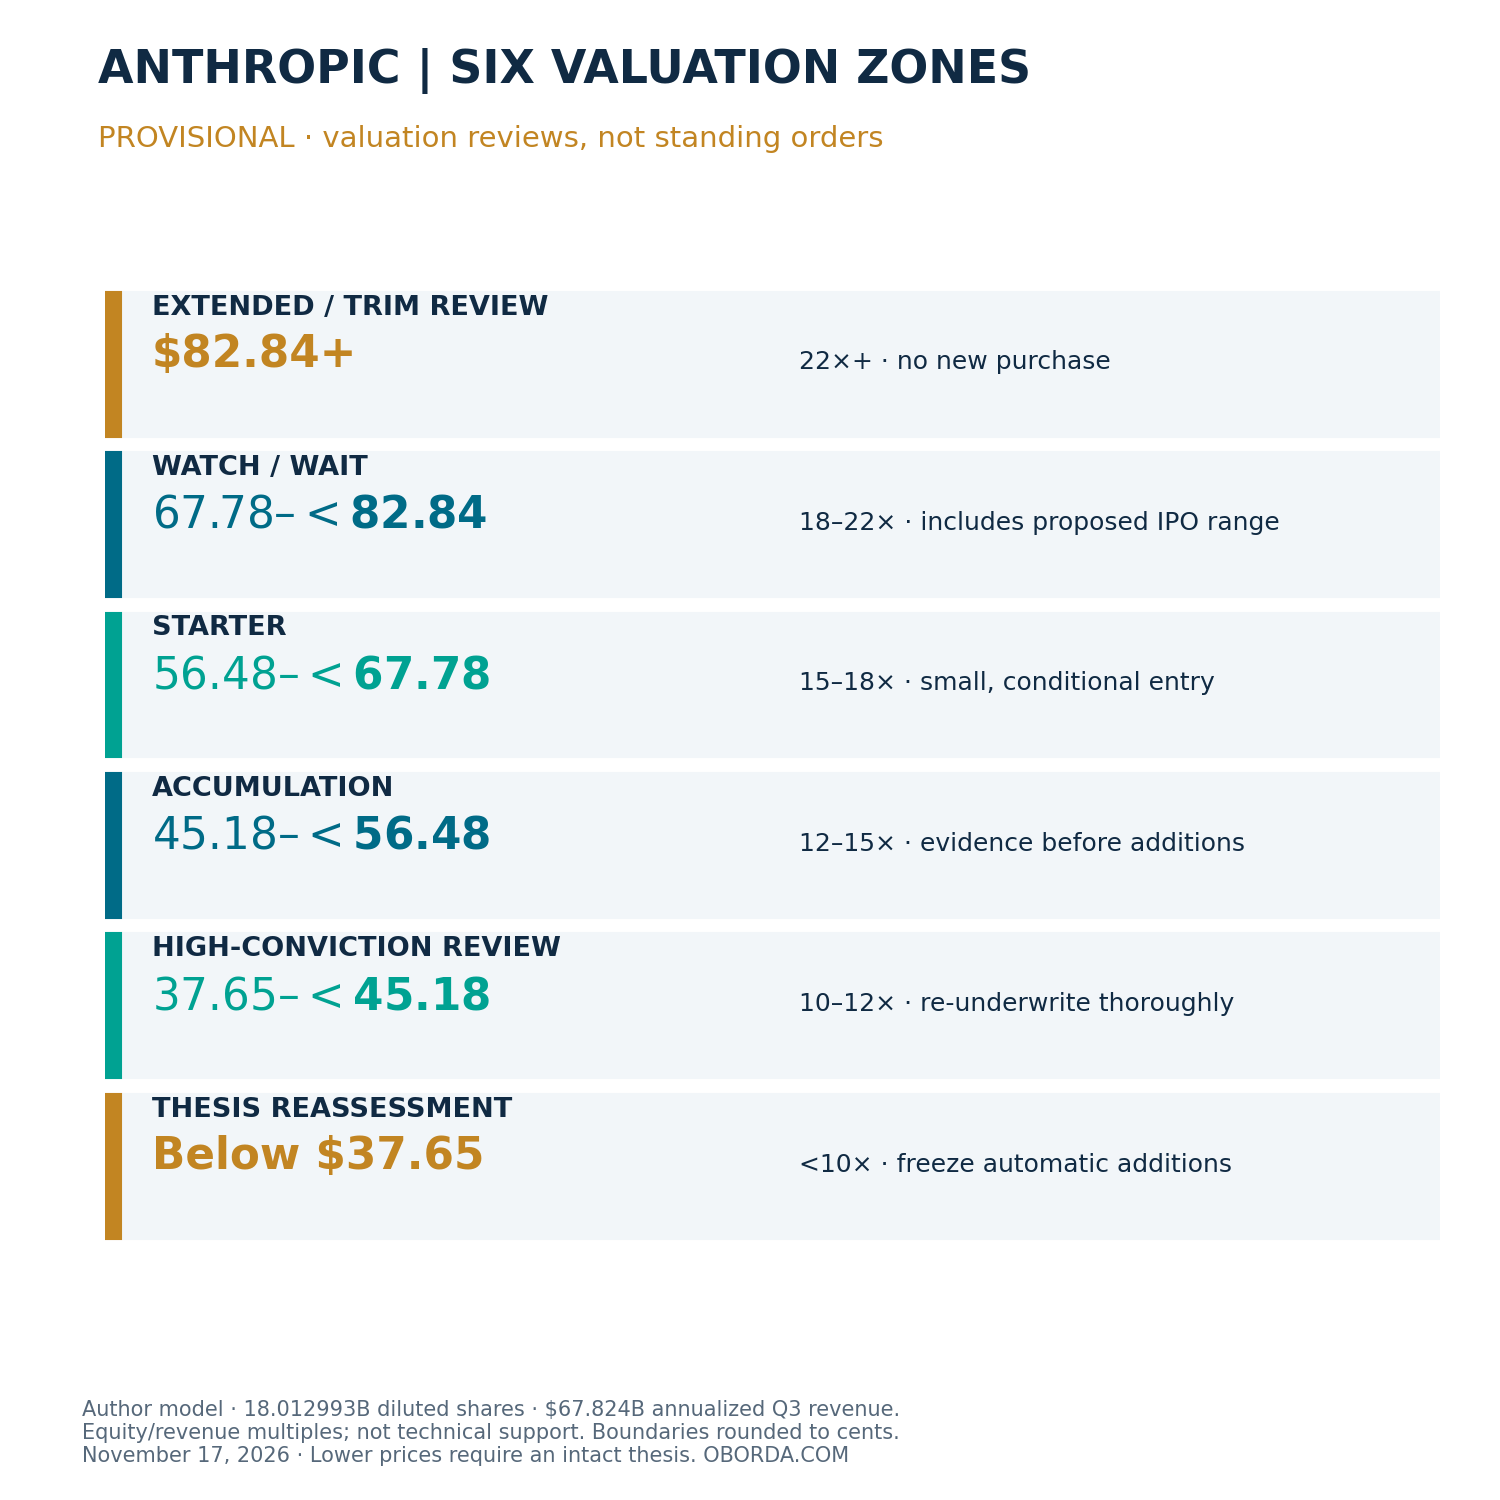
These are provisional valuation zones, not technical support or automatic orders. Boundaries equal my selected 10×, 12×, 15×, 18× and 22× annualized-Q3-revenue equity multiples divided by 18.012993B diluted shares. Whole-cent boundaries are rounded.
There is no public price history from which to claim support, moving averages, volume trends or a 52-week correction.
| Classification | Price range | Diluted equity value; annualized-Q3 multiple | OODA action, evidence required and pause condition |
|---|---|---|---|
| Extended / potential trim | $82.84 and above | About $1,492B+; 22×+ | No new purchase under this model; existing holders review concentration. Requires exceptional durable growth to justify. Raise boundaries only after better results, not enthusiasm. No short-sale recommendation. |
| Watch / wait | $67.78 to below $82.84 | About $1,221B–$1,492B; 18–22× | Observe disclosures; insufficient margin for my uncertainty. Includes $70–$78 range. Pause if growth slows faster than spending adjusts. |
| Starter | $56.48 to below $67.78 | About $1,017B–$1,221B; 15–18× | Consider a small staged entry only after final terms, cash obligations and demand remain credible. Still a premium valuation. Pause on deteriorating retention or unit economics. |
| Accumulation | $45.18 to below $56.48 | About $814B–$1,017B; 12–15× | Add selectively after results demonstrate durable demand and cash conversion. Additional discount compensates for model and dilution risk. Pause if commitments outgrow funding capacity. |
| High-conviction review | $37.65 to below $45.18 | About $678B–$814B; 10–12× | Conduct a fresh, rigorous review; larger purchases require stronger evidence and acceptable portfolio exposure. The name is a review standard, not current high confidence. Stop if the moat or solvency case weakens. |
| Thesis reassessment | Below $37.65 | Below about $678B; below 10× | Investigate why. Freeze automatic additions; rebuild revenue, cost and share assumptions. A broken thesis can make even this price expensive. |
The multiples are my risk allowances, not peer-derived fair values. Ten times annualized sales can still be expensive. The 18× starter ceiling offers a modest valuation concession to the midpoint’s 19.7×; the deeper bands demand progressively more compensation for uncertain profits. None establishes intrinsic value with high confidence.
After final pricing, recalculate the placement shares, option treatment and diluted base. After trading starts, observe spreads, liquidity and developing price ranges without treating them as proof of value. After results, replace the annualized-quarter anchor with updated comparable periods and revise the business assumptions.
Lower prices do not automatically justify larger purchases. Buy the discount, not just the dip.
Bear, Base and Bull: Conditional Outcomes, Not Predictions
Horizon: approximately two years, using FY2028 annual revenue assumptions. Each case assumes 20B diluted shares, about 11% above the midpoint model, and uses an equity/revenue multiple with no additional cash adjustment.
Returns compare with $74 and exclude fees, taxes and dividends. These are analytical scenarios, not company forecasts or probability-weighted expected returns.
| Case | FY2028 revenue; cash-generation assumptions | Equity multiple / value | Price / return from $74 | What would invalidate the case |
|---|---|---|---|---|
| Bear | $90B; 5% FCF margin, $4.5B FCF; growth decelerates, competition and capacity costs persist | 5× / $450B | $22.50 / −69.6% | Strong sustained cash margins and durable expansion make this too pessimistic |
| Base | $150B; 15% FCF margin, $22.5B FCF; enterprise usage expands and costs moderate | 10× / $1,500B | $75.00 / +1.4% | Retention deterioration, much heavier dilution or failure to generate cash defeats it |
| Bull | $220B; 22% FCF margin, $48.4B FCF; deep workflow adoption and improved compute efficiency | 15× / $3,300B | $165.00 / +123.0% | Persistent price pressure, inferior models or capacity bottlenecks undermine it |
At a hypothetical $110 opening purchase, these same prices imply approximately −79.5%, −31.8% and +50.0%. Paying more shifts the outcome distribution against the buyer even if nothing about the company changes.
The base and bull cases still imply demanding value/FCF ratios of about 67× and 68×; these are growth-stock assumptions, not a conservative Buffett-style bargain.
Confidence is high in arithmetic and the cited disclosed terms, moderate in the existence of strong commercial adoption, and low in the two-year revenue, cash-margin and multiple assumptions. No defensible probabilities are assigned.
A material loss of customer trust, durable model competitiveness, financing access or the ability to meet obligations would invalidate a purchase thesis at any zone.
What Can Happen After a Stock Goes Public?
An IPO is a transition in ownership and price discovery, not a predictable price cycle. The stages below can overlap, recur, be skipped or occur in a different order. The windows are approximate educational examples, not Anthropic trading instructions. [S12] [S13]
| Stage | What may happen to price | Potential buyers | Potential sellers | What retail investors should observe |
|---|---|---|---|---|
| IPO pricing and allocation; days/weeks before listing | Issuer and underwriters assess orders through bookbuilding and negotiate an offering price | Institutions, eligible retail channels and other allocated investors | Company issuing new shares; disclosed selling holders | Final prospectus, allocation rules, price revisions and exact security rights |
| Opening price discovery; first auction/minutes | First trade may gap above or below offering price as orders meet | Institutions, retail, market makers and traders | Eligible allocation recipients and other legally available holders | Indicative clearing price, order imbalances, spreads and executable limits |
| Enthusiasm or disappointment; hours/days | A surge, reversal or weak debut can follow demand surprises | Momentum traders, retail and institutions | Permitted allocation recipients taking profits; eligible earlier holders | Whether valuation still works at your actual price; avoid inferring identities from candles |
| Early trading and stabilization; days/weeks | Underwriters may support orderly trading or cover overallotments; price can still fall | Investors and, where applicable, stabilization agent | Ordinary participants and eligible holders | Option exercise and stabilization disclosures; no guaranteed floor |
| Consolidation or continued momentum; days/months | Demand may fade, strengthen or settle into a range | Long-only funds, traders and value-oriented retail | Short-term buyers, rebalancing institutions and eligible holders | Trading depth, range behavior and business news; a range is not intrinsic value |
| First public earnings; weeks/months | Results and guidance can create new highs or lows | Funds and retail updating business forecasts | Investors disappointed by growth, costs or guidance | Comparable revenue periods, cash conversion, dilution and commitments |
| Early releases and lockups; days to a year or more | More eligible supply can pressure price, or be absorbed | Institutions and retail seeking greater liquidity | Eligible employees, founders, venture funds and strategic holders | Holder-specific release terms; eligibility is not evidence of actual selling |
| Longer-term repricing; months/years | Execution and the valuation paid increasingly shape returns | Investors focused on durable cash flows; other market participants | Holders revising their thesis or funding other needs | Competitive position, profitability, capital allocation and per-share value |
Retail allocation access varies by broker, jurisdiction, eligibility and demand. An indication of interest is not a guaranteed allocation. Some allocation recipients may sell promptly if allowed; broker policies can affect future allocation access.
Long-only institutions may build multi-year positions, while venture funds can eventually distribute shares or seek exits. Employees and founders may sell for diversification rather than because the business is failing. [S12]
Nasdaq’s IPO auction aggregates buying and selling interest to establish an opening price; continuous trading follows. That opening need not occur at 9:30 a.m. and need not resemble the negotiated offering price. Thin available supply, imbalanced orders and wide spreads can magnify price changes. [S13]
Market makers generally provide liquidity and manage inventory; momentum traders seek price movement. Short sellers may express a negative view or hedge, but require compliant borrowing/locate arrangements, face borrow fees and recall risk, and may have limited supply available in a new listing. A falling price alone does not prove short selling.
Insider sales remain constrained by applicable securities laws, company trading policies, lockups and registration/exemption requirements; a contractual release does not authorize trading on material nonpublic information. [S1] [S14]
Anthropic’s prospectus identifies Morgan Stanley as potential stabilization agent. Purchases and overallotment-related activity may influence price but can stop; neither the proposed option nor stabilization establishes a floor.
Allocation recipients, funds, founders, employees, market makers, short sellers, momentum traders and retail investors are possible participants. Price and volume alone do not identify which group bought or sold. [S1]
Anthropic’s Actual Supply Calendar: No Universal 180-Day Rule
The preliminary release schedule is unusually important. These are maximum eligible quantities, rounded as disclosed—not forecasts of sales or additional shares created on those dates.
Class N generally requires conversion for public Class A trading. Final terms and legal eligibility must be checked. [S1], Shares Eligible for Future Sale and Underwriting.
| Trigger measured from final prospectus or results | Potential eligible supply / rule |
|---|---|
| First trading day following prospectus date | Up to 315M employee/non-founder director/officer/consultant shares; generally 10% early release for that group |
| Days 27 and 48 after prospectus, each | Up to 303M A+N shares per event |
| Days 62 and 76 after prospectus, each | Up to 353M A+N shares per event |
| Second full trading day after FY2026 results | Up to approximately 1.7B A+N shares; includes further employee and investor releases |
| Days 13, 27, 41, 55 and 69 after FY2026 results, each | Up to approximately 480M A+N shares per event |
| Ordinary lockup outside applicable early releases | Earlier of second full trading day after Q1 2027 results or close on day 180 |
| Founders and specified holders above 0.5% diluted ownership | Longer restrictions: earlier of second full trading day after Q3 2027 results or close on day 365; holder-specific exceptions/early releases apply |
| Concurrent $26B placement | No underwriter lockup; restricted securities still require registration or an exemption before resale |
Additional larger-holder provisions include phased early releases and permitted hedging arrangements; these are not identical to the ordinary-holder schedule. Underwriters may waive restrictions.
The filing also discusses registration rights, remaining Amazon note conversions and future compensation/benefit issuances. Note conversion or a secondary sale is not automatically new cash for Anthropic.
I would not turn the preliminary November 17 cover date into definitive calendar release dates. Rebuild the schedule from the final prospectus date and actual earnings dates, apply next-trading-day rules, and check waivers, notices and holder-specific conditions.
Do not add the headline quantities without reviewing overlapping restrictions and prior releases. The offering’s 825M publicly sold shares are separate from these potential restricted-holder releases. [S1]
The Highs and Lows: Six Different Prices
The offering price is what successful allocated investors pay. The first public trading price comes from the opening process. The intraday high and low are the session’s extremes. The closing price is the end-of-session reference.
A post-IPO peak is the highest price over a specified later window; a subsequent trading-range low is the lower boundary observed during a defined later period. Neither can be identified reliably in advance, and later extremes can replace them.
The allocation buyer is up 29.7% at the close; someone buying at $110 is down 12.7%.
If the stock later reaches $150 and then trades in an $80–$100 range, the later peak is $150 and that subsequent range’s low is $80. At $80, the allocation buyer remains up 8.1%, while the $110 buyer is down 27.3%.
These comparisons exclude fees and taxes and assume the holder can transact; they are not promises of available executions.
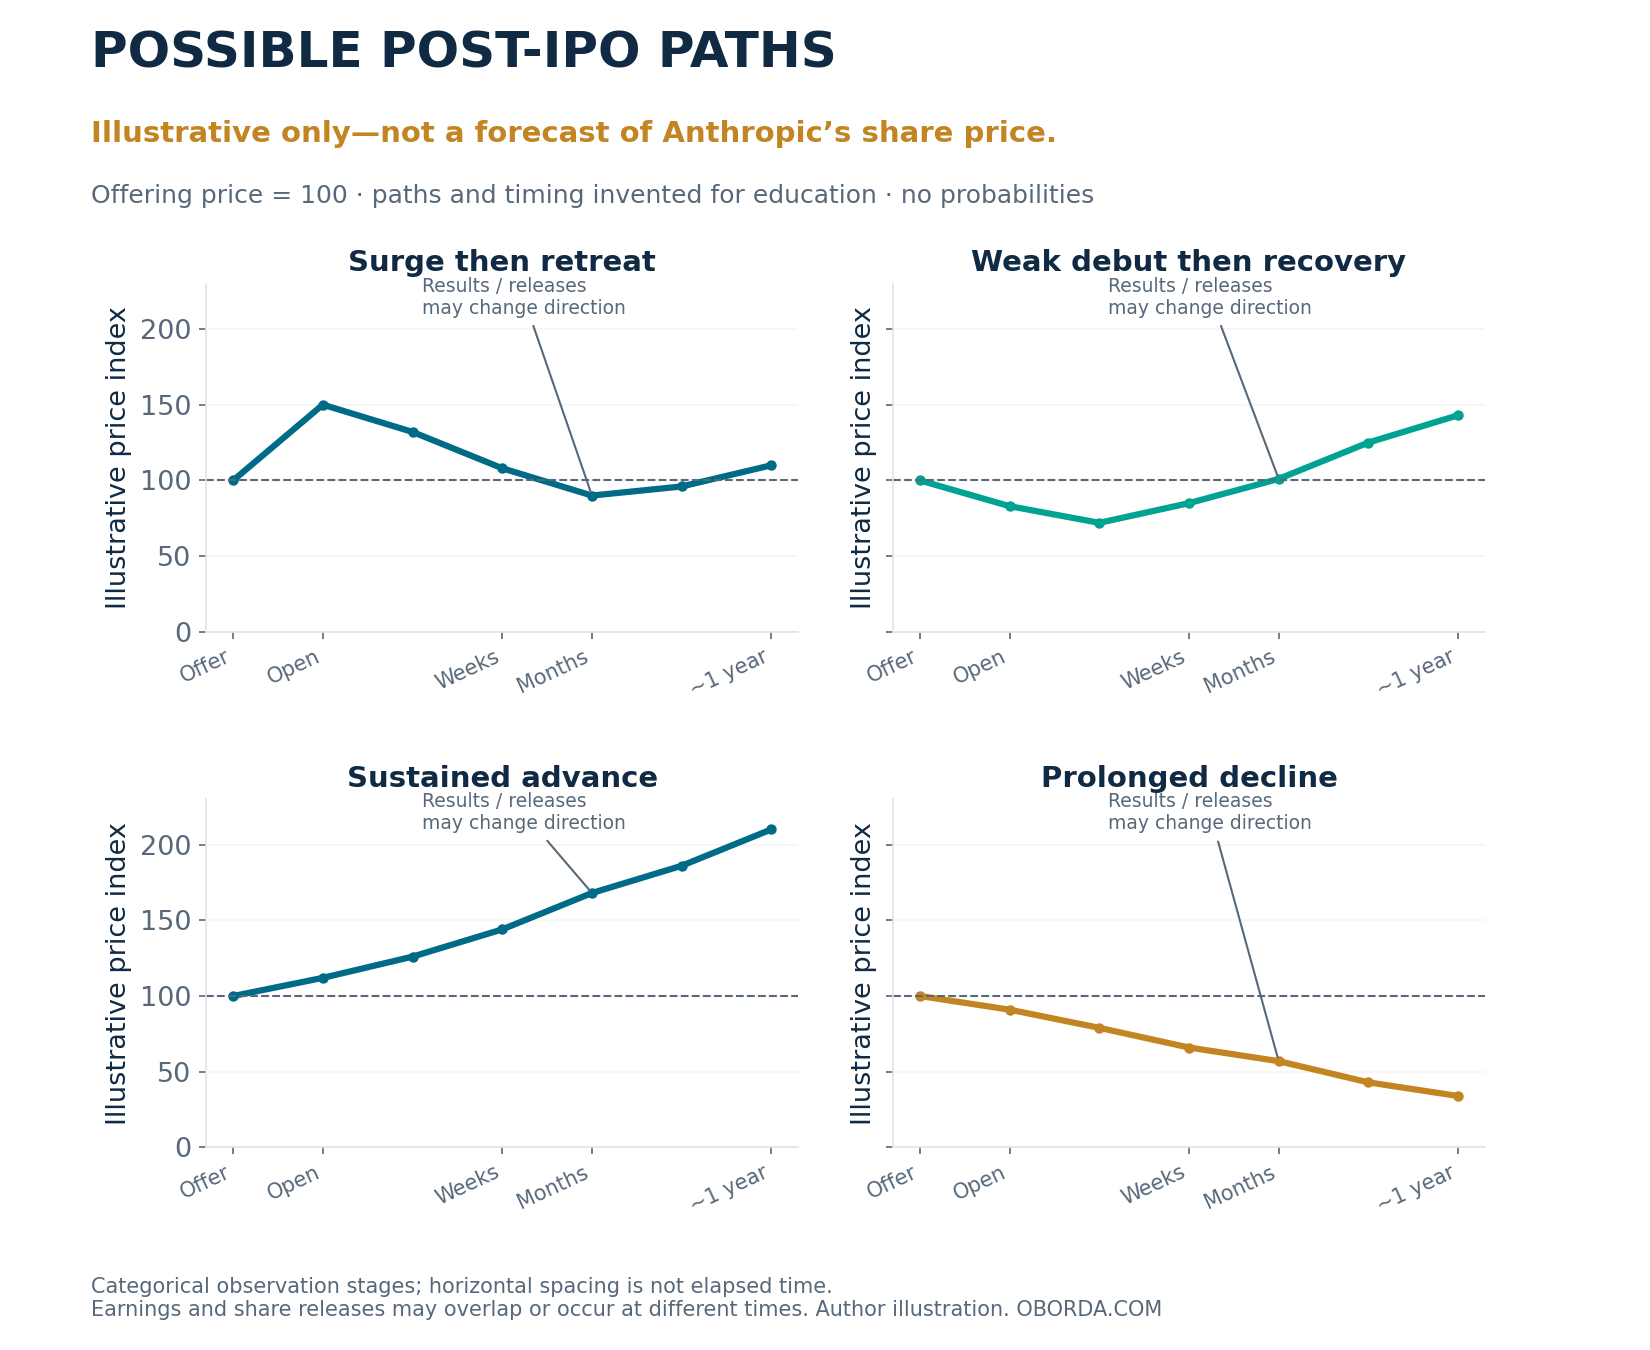
The chart is not a dollar-price target, prediction or probability distribution. Stage markers are possible observation points, not a trading sequence.
Excitement and limited immediately available supply can produce a temporary high. Profit-taking, disappointing results, more available shares or a weak market can produce a low.
A below-IPO stock can still be expensive if earnings power has deteriorated; an above-IPO stock can still offer value if per-share cash prospects improve faster than price. The offering price is a financing outcome, not a permanent measure of fair value. The exact peak and bottom are unknowable beforehand.
Decide and Act: My Practical Retail Plan
| When | My conditional action |
|---|---|
| Before final pricing | Read the final prospectus; verify range, share bridge, private-placement closing conditions and lockups. At $70–$78, I would decline an allocation under this model unless new evidence materially improves value. Broker access is not a reason to change the price limit. |
| Opening day | Compare the executable price with the updated valuation. At $90, $110 or $130, I would wait. Use a limit order if buying after a qualifying reassessment; a limit caps price but does not guarantee a fill. Check spreads and avoid money needed soon. |
| First weeks | Watch liquidity, releases and business news; reassess any selloff before adding. A staged starter might be 0.25%–0.5% of a diversified portfolio, purely as an illustrative risk budget, with total exposure set before buying. |
| After initial earnings | Test revenue quality, customer expansion, compute expense, cash conversion, compensation and share count against the thesis. Revise zones before considering further tranches. |
| Around verified releases | Refresh the actual calendar, identify which holders become eligible and observe absorption. Do not presume selling or place automatic bargain orders merely because supply may rise. |
A speculative trade depends on near-term price movement and needs a separate loss budget and exit discipline. A long-term investment depends on the business producing sufficient per-share cash over years.
I would not relabel a losing speculation as a long-term holding to avoid reassessment. Staggering reduces entry-timing concentration; it does not cure an overvalued or impaired business.
Observe → Verify final terms, financial performance, obligations and share releases.
Orient → Weigh Claude’s adoption against competition, capital intensity, governance and dilution.
Decide → At $70–$78, my current answer is wait; in the $56.48–$67.78 starter band, consider only a small entry if final terms and the business remain sound.
Act → Use price limits and staged purchases when both evidence and valuation qualify. At materially higher opening prices, let the market trade without me.
Cash is a position. Don’t chase. Staggered purchases. No all-ins. Buy the discount, not just the dip.
Research Limits and Sources
The data cutoff is November 17, 2026, morning ET, before expected final pricing. Final price, effective registration, actual opening, placement completion, final underwriting economics and definitive calendar release dates are unresolved.
I have not verified a complete current cap table for every private investor, live order books, fund flows, borrow rates or inference-only margins. Forecasts and zone multiples are OBORDA assumptions. These gaps particularly limit confidence in entry timing and intrinsic value.
No personal holdings or transactions are represented. Educational investment commentary, not individualized investment advice.
Linked Source List
- S1 — SEC S-1/A Amendment 3, November 17, 2026 . Preliminary terms; September 30 interim financials; capitalization; dilution; governance; ownership; future sale restrictions. Especially pages 19–29, 128–186, 251–262, 299–324 and 330–349.
- S2 — Anthropic roadshow announcement, November 10, 2026 .
- S3 — Reuters market report, November 17, 2026 . Expected pricing/trading dates and dated market context.
- S4 — Anthropic/Amazon expansion, April 20, 2026; updated April 21 .
- S5 — Anthropic Series H announcement, May 28, 2026 .
- S6 — Anthropic Series G announcement, February 12, 2026 .
- S7 — Microsoft/NVIDIA/Anthropic partnership, November 18, 2025 . Historical commitments, subsequently updated by financing disclosures.
- S8 — Anthropic Google/Broadcom compute expansion, April 6, 2026 .
- S9 — Anthropic IPO fact sheet, November 2026 . Company product and customer presentation; company-reported metrics.
- S10 — Anthropic customer case-study directory . Accessed November 17, 2026.
- S11 — Long-Term Benefit Trust, September 2023; subsequently updated . Background; the current filing controls the IPO structure.
- S12 — SEC Investor Bulletin: Investing in an IPO, 2013 . General education; old numerical regulatory thresholds are not relied upon.
- S13 — Nasdaq IPO Cross fact sheet . Accessed November 17, 2026.
- S14 — Investor.gov: An Introduction to Short Sales . October 29, 2015; updated September 9, 2026.
- S15 — Reuters report on retracted preliminary terms, November 10, 2026 . Superseded figures; not valuation inputs.
- S16 — Anthropic Series E announcement, March 3, 2025 .
Related OBORDA Reading
AT&T: FAA Opportunity, OODA Analysis and Buy Zones — a verified example of applying valuation discipline to a different business; it is not an Anthropic comparable.