

OBORDA / Investment Analysis / November 11, 2026
This GOOGL OODA analysis asks whether Alphabet’s sharp correction has created a sufficient discount. At the $293 reference price, my answer is WAIT. Cloud growth is strong, but cash conversion and the technical trend do not yet support aggressive buying.
A lower stock price creates a question, not an automatic purchase. Alphabet’s investment opportunity depends on whether AI spending produces durable earnings and cash returns. The current earnings valuation is more attractive than it was near the high, but cash-flow valuation remains a major concern.
Research status: CONDITIONAL. This dated report preserves the analysis’s November 11 snapshot. Forward estimates conflict across providers, technical indicators were not independently recalculated, and live positioning data were unavailable. Zones are conditional decision ranges. Facts, calculations, assumptions, and judgments are identified below.
That is the OBORDA discipline: OBserve. ORient. Decide. Act. The question is whether Alphabet’s prospects justify the risk at each price.
Data Integrity and Market Snapshot
Source-reported fact: Google Finance showed $293.00 at 11:56:04 a.m. EST on November 11, 2026. This is an intraday snapshot, not a live quote. Financial results cover September 30; daily technical readings cover November 10. [1]
| Metric | Value |
|---|---|
| Reference price | $293.00 |
| November 10 close | $287.38 |
| 52-week intraday high / low | $408.61 / $270.70 |
| Approximate market capitalization | $3.59 trillion |
| Calculated correction from high | 28.29% |
Calculation: ($408.61 − $293.00) ÷ $408.61 × 100 = 28.29%.
A return to the old high would require 39.46% upside. That does not make the old high fair value. Price providers use slightly different adjusted ranges; the correction above consistently uses Google Finance’s intraday range. Historical prices corroborate the previous close. [2]
The business is growing. Cash conversion is the test.
| Metric | Result |
|---|---|
| Revenue | $127.6B; +25% year over year |
| Search growth | 12% |
| Google Cloud revenue / growth | $30.7B / 103% |
| Operating income / margin | $40.6B / 31.8% |
| GAAP EPS | $2.12 |
| Operating cash flow / capex | $42.3B / $51.4B |
| Quarterly / trailing twelve-month FCF | −$9.1B / $19.7B |
Alphabet’s release shows substantial operating growth alongside negative quarterly free cash flow. [3] Search growth slowed from 17% in Q2 to 12% in Q3. Q2’s $9.11 EPS included large investment gains and should not be extrapolated as recurring earning power. [4]
Judgment: Search, YouTube, Cloud, and proprietary AI infrastructure support a strong franchise. The investment question is whether the expanding capital base will earn attractive returns after depreciation, operating expenses, and dilution.
Earnings expectations and management guidance
Reuters reported that revenue missed expectations and adjusted EPS of $2.67 fell short of the $3.02 estimate; shares fell about 10% after hours. Strong Cloud demand did not resolve the market’s concern about Search monetization and spending. [5]
Management maintained 2026 capex guidance of $195–205 billion, expects a significant increase in 2027, and warned of near-term Cloud margin pressure from third-party capacity. The $561 billion Cloud backlog provides demand visibility, but conversion takes time and investment. [6]
Balance sheet, dilution, and capital allocation
Reported cash and marketable securities were about $265 billion; long-term debt carrying value was approximately $125 billion. Liquidity remains substantial, but infrastructure commitments and financing matter. Q3 common-stock issuance generated about $12.4 billion, while year-to-date repurchases were zero. [3] [7]
Normalized ROIC has not been independently reconstructed. Investment gains and a rapidly expanding infrastructure asset base limit the usefulness of headline return ratios.
Technicals: stabilization within a damaged trend
| Indicator | Reading | Meaning |
|---|---|---|
| 20-day moving average | $310.89 | First recovery hurdle |
| 50-day moving average | $330.71 | Intermediate trend remains weak |
| 200-day moving average | $338.79 | Long-term recovery hurdle |
| 14-day RSI | 32.5 | Weak momentum |
| MACD histogram | −1.78 | Negative momentum |
| 14-day ATR | $10.43 | Large daily volatility |
Price is below all three moving averages, and the 50-day is below the 200-day. [8] Recent prices identify approximately $277–280 support and $295–296 resistance. [2] [9]
Judgment: Sustained recovery above $311, followed by $331–339, would strengthen the trend evidence. A sustained break below $270–277 would weaken the stabilization thesis. These signals help manage timing; they do not establish intrinsic value.
Valuation: why the headline P/E is incomplete
Using reported trailing EPS of approximately $19.15, $293 represents about 15.3× earnings. However, 2026 investment gains inflate that denominator. [1] [4]
Model assumption: I use $15 prospective annual EPS. One dated source reports 2027 EPS of $15.04, but estimate pages were inconsistent on retrieval, and providers disagree on forward valuation. The $15 input is therefore an assumption rather than a fully reconciled consensus fact. At that input, $293 represents 19.5× earnings. [10] [11]
Reported historical year-end forward multiples for 2022–2025 span roughly 18–29×. A lower multiple is encouraging, but today’s capital intensity makes a mechanical return to past multiples inappropriate. A consistent current forward comparison with META, MSFT, and AMZN was unavailable and is excluded. [11]
Scenario values over 12–18 months
| Scenario | EPS × P/E | Value | Return from $293 |
|---|---|---|---|
| Bear | $12 × 18 | $216 | −26.3% |
| Base | $15 × 23 | $345 | +17.7% |
| Bull | $18 × 25 | $450 | +53.6% |
The bear case assumes weaker monetization and cost pressure. The base case requires resilient Search, continued Cloud scaling, and confidence in eventual cash recovery. The bull case requires stronger AI economics and investment efficiency. Returns exclude dividends, taxes, and trading costs; no scenario probabilities are assigned.
Calculated base reward/bear risk: ($345 − $293) ÷ ($293 − $216) = 0.68×. The base case already grants a 23× multiple. That payoff does not justify aggressive deployment.
Cash-flow cross-check: a material warning
Calculated trailing FCF yield is approximately 0.55%: $19.747B ÷ $3,590B. An illustrative five-year equity cash-flow model uses annual cash available to common equity of $25B, $50B, $80B, $110B, and $140B; a 10% required return; 4% terminal growth; $130B assumed distributable excess financial assets; and 12.3B shares with no further dilution.
Value per share = {Σ[CFt ÷ 1.10t] + [$140B × 1.04 ÷ (0.10 − 0.04)] ÷ 1.105 + $130B} ÷ 12.3B = approximately $156.
The sensitivity is approximately $133–188 using 11%–9% required returns. The same ramp shape requires roughly $271B of year-five cash flow to support $293. This is an illustrative equity model, not a company forecast or an enterprise-value DCF. The assumed excess assets must be distributable without double-counting cash needed for operations. Lower excess assets or dilution reduce value.
Judgment: The sharp disagreement between cash-flow value and earnings-based scenarios blocks a high-conviction rating. The six zones below are conditional earnings-and-technical decision ranges, not DCF-supported declarations of fair value.
Market, sector, seasonality, and flows
November 11 brought an early AI-related market rebound, but interest-rate expectations remained a headwind. [12] October CPI rose 0.4% month over month and core CPI rose 0.3%. [13] Strong AI demand can coexist with weak shareholder cash returns when infrastructure spending rises faster than monetization.
Historical November and post-midterm patterns are generally supportive, but samples and outcomes vary. Seasonality receives modest weight; it cannot override company cash flow or valuation. [14]
Corporate flows show issuance and no year-to-date repurchases. An accessible short-interest series reports 78.4 million shares, or 1.34% of float, settled October 15. A newer secondary snapshot reports 87.6 million settled October 30, but was not independently verified. Neither establishes a crowded-short thesis. [15] [16]
November 10 volume was about 28.3 million shares. A quiet session does not prove institutional accumulation. Verified live institutional net flows, ETF-specific flows, dealer gamma, and comprehensive recent insider activity were unavailable. A matched-period total-return relative-strength calculation was also unavailable. No directional flow claim is assigned to missing data.
Catalysts and risks worth monitoring
| Potential catalyst | Evidence needed |
|---|---|
| Q4 results and 2027 capex outlook | A credible link from spending to earnings and cash recovery |
| Cloud backlog and TPU sales | Revenue conversion, cash collection, and acceptable capital returns |
| AI monetization in Search | Commercial revenue keeping pace with usage |
| Technical and market recovery | Durable price improvement with less discount-rate pressure |
Main risks include Search substitution, slower monetization, depreciation and energy costs, overcapacity, dilution, and regulation. The DOJ’s recent ad-tech remedies include interoperability, data-sharing, and anti-discrimination requirements. Their eventual economic impact remains uncertain. [17]
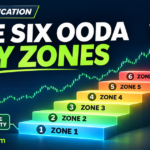
GOOGL OODA analysis: Buy Zones and Boundary Evidence
These freshly derived boundaries are judgments, rounded for uncertainty. They are continuous and nonoverlapping. The lower labels identify candidates for investigation; they do not authorize purchases if fundamentals deteriorate.
| Zone | Price | Boundary evidence | Confidence |
|---|---|---|---|
| 🔴 No New Buys / Trim Review | $350 and above | Above $345 base value; at least 23.3× assumed EPS. Approaches $359–364 overhead structure. Trim decisions require position and tax context. | Moderate |
| 🟡 Watch | $310 to below $350 | $310 approximates the 20-day average; $331–339 contains longer averages. Only 11.3% base upside at $310. | Moderate |
| 🟢 Starter candidate | $280 to below $310 | $280 aligns with recent stabilization; 18.7–20.7× assumed EPS. Cash-flow concerns block an automatic starter at $293. | Moderate-low |
| 🟢🟢 Accumulation candidate | $255 to below $280 | Contains $270–277 support. $255 is 17× assumed EPS, near the reported lower Bollinger area, with a 26% base-value discount. | Moderate-low |
| 🔥 High Conviction—conditional | $225 to below $255 | 15–17× assumed EPS and a 26–35% base-value discount. Valuation boundaries, not verified historical support. Requires cash recovery evidence. | Low |
| ⚡ Exceptional / Reassess | Below $225 | Below 15× assumed EPS; approaches the $216 earnings bear case. The cash-flow model still allows lower value. Reassess for impairment. | Low |
Technical anchors are provider-reported; valuation anchors use the disclosed $15 EPS assumption. [8] Strong business quality supports investigating a discount, while weak cash conversion and market conditions raise the required margin of safety.
Execution, opportunity cost, and invalidation
At $293, cash preserves the option to buy after a support test or clearer cash-flow evidence. A diversified index reduces company-specific exposure, although its superior current valuation has not been established here. Existing direct holdings and index exposure must both count toward concentration.
If a future purchase qualifies, an illustrative first tranche is 20% of intended GOOGL capital, with later tranches requiring fresh evidence. High-conviction sizing remains blocked while cash conversion is unresolved. Personal share counts, position values, tax lots, and trim quantities are excluded from this public report.
Judgment-based reassessment thresholds:
- Search growth below roughly 8% for two consecutive quarters, accompanied by monetization deterioration, weakens the franchise thesis.
- Continued cash deterioration without a credible recovery path invalidates the $345 earnings-based base case.
- Prospective normalized EPS below $12 requires rebuilding all zones.
- Regulatory changes materially impairing distribution or ad economics require immediate reassessment.
- A sustained break below $270–277 invalidates near-term stabilization; it does not alone prove business impairment.
Confidence: Moderate in the WAIT decision; low-to-moderate in precise zone boundaries. The missing or conflicting inputs reduce conviction. This report does not represent an unconditional research pass.
OODA: Observe. Orient. Decide. Act.
Observe: GOOGL is 28.29% below its 52-week high. Operating growth is strong; quarterly free cash flow is negative.
Orient: Approximately 19.5× assumed prospective earnings is reasonable, but cash-flow support and technical confirmation remain weak.
Decide: WAIT at the $293 reference price. Base upside of 17.7% versus bear downside of 26.3% does not justify aggressive buying.
Act: Reassess around $270–280 for support and updated fundamentals, or after sustained recovery above $311 with better earnings and cash-flow evidence. Price alone does not authorize a purchase.
Don’t buy the dip. Buy the discount. A discount must survive scrutiny of the business, its cash requirements, and the alternatives for the next dollar.
Sources and Method
Sources were consulted for the November 11, 2026 analysis. Market pages change over time and may now display different values. Models and zones are OBORDA judgments. No analyst target is presented as a guaranteed outcome.
- Google Finance — GOOGL quote and 52-week range; snapshot November 11, 11:56:04 a.m. EST.
- Yahoo Finance — historical prices; completed sessions through November 10.
- Alphabet Q3 2026 earnings release, SEC Exhibit 99.1; October 28, 2026.
- Alphabet Q2 2026 earnings release; July 22, 2026.
- Reuters — Alphabet earnings and market reaction; October 28, 2026.
- Alphabet investor relations — earnings-call commentary; Q3 2026 transcript consulted November 11. This generic event page may change; the SEC release above is the stable financial reference.
- Alphabet Form 10-Q, September 30, 2026; financing, commitments, and financial-quality details.
- Tickzen — GOOGL technical indicators; November 10 daily readings. Not independently recalculated.
- Stock Analysis — historical trading prices; recent support/resistance context.
- TGMCharts — dated forward EPS estimates; inconsistent retrieval, used only as context for an explicitly assumed EPS input.
- Stock Analysis — historical valuation ratios; period definitions differ across providers.
- Reuters — November 11 market and AI-sector context; early-session report.
- BLS — Consumer Price Index; October 2026 release consulted November 11. Latest-release page changes with subsequent releases.
- J.P. Morgan Private Bank — year-end and midterm seasonality; historical context, not a forecast.
- Benzinga — dated short-interest series; October 15 settlement.
- Gainbot — newer short-interest snapshot; not independently verified.
- U.S. Department of Justice — Google ad-tech remedies; regulatory risk context.
Explore more research at OBORDA Investment Journal. Specific related-article URLs were not verified and have not been invented.
Disclosure: Educational analysis, not individualized investment advice. Investing involves potential loss of principal. Valuation assumptions, estimates, and market conditions can change. This report does not disclose the author’s holdings; no ownership status is asserted.