
OBORDA / October 9, 2026 / As-of October 8 regular-session close / USD
Qualcomm Stock: 6 Buy Zones After a 32% Correction
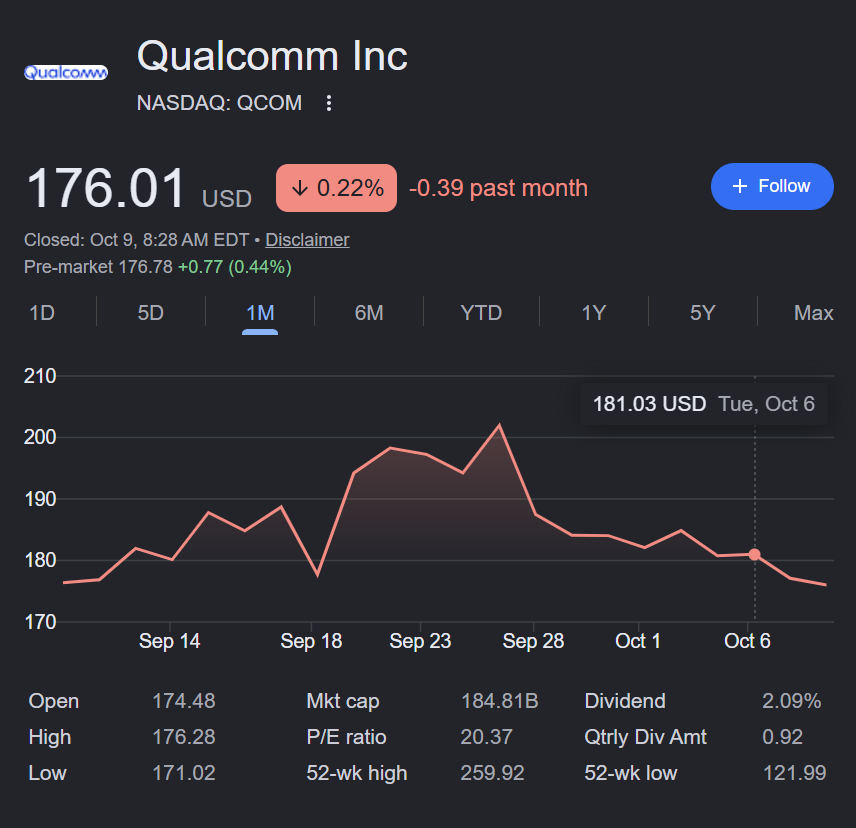
Qualcomm Stock is deeply below its peak. But a large correction cannot substitute for verified earnings power. QCOM closed October 8 at $176.01 against a 52-week high of $259.92 and low of $121.99. Correction = ($176.01 ÷ $259.92 − 1) × 100 = −32.28%. This is the last completed-session close, not a live October 9 quote.
Research gate: CONDITIONAL. Verified filings, cash flows, comparative valuation metrics and dated technicals are used below. Prospective FY2027 estimates are third-party snapshots, not management guidance. Valuation scenarios and zones are explicitly conditional. The next earnings release can invalidate them.
Qualcomm Stock Market Message
The September 25 high of $205.85 gave way to a September 28 close of $187.48; QCOM reached $171.02 intraday October 8 and recovered to $176.01. This price path indicates elevated volatility, not proven capitulation. September 28 commentary cited post-Snapdragon-Summit profit-taking and Samsung 2nm foundry uncertainty, but those explanations cannot quantify individual order flow.
On October 8 the Nasdaq fell about 1.25% and S&P 500 0.47% amid technology-sector pressure, oil prices and interest-rate concerns. Market: 🟡 mixed/rotational with defensive pockets. Qualcomm has both sector-wide exposure and company-specific handset weakness. Insider and fund flow causality is not established.
QCOM Stock Buy Zones: Conditional Decisions
Boundaries combine recent traded prices and moving averages with a sensitivity analysis using the third-party forward EPS implied by a quoted 18.99× forward P/E (about $9.27). This is a rolling estimate, not a verified fiscal-year forecast. The ranges are decision tiers, not orders or promised support.
| Zone | Price (USD) | Evidence and action |
|---|---|---|
| 🔴 No new buys / consider trim | Above $205 | September 25 swing high $205.85; >22× implied forward EPS. Trim only on excessive valuation, concentration or failing fundamentals. |
| 🟡 Watch | $186 to $205 | 20-day SMA $186.23; October 2 high $188.95. Reclaim and hold with volume before trusting a recovery. |
| 🟢 Conditional starter | $171 to below $186 | October 8 intraday low $171.02; 50-day SMA $172.63. A starter requires an observed base/reversal and no earnings downgrade. |
| 🟢🟢 Conditional accumulation | $158 to below $171 | 200-day SMA $169.34 sits just above this tier; around 17× to 18.4× implied forward EPS. Require repeated support and retained guidance. |
| 🔥 High-conviction candidate | $140 to below $158 | ~15×–17× implied forward EPS; wide discount, but only high conviction if normalized FCF and handset trend are sound. |
| ⚡ Exceptional / reassess | Below $140 | Below about 15× implied forward EPS is not automatically cheap if EPS falls. Stop and redo thesis and financial model. |
Boundary audit: $205 corresponds to the September 25 $205.85 swing high; $186 to the October 8 $186.23 20-day SMA; $171 to the October 8 low/50-day average; $158 and $140 are rounded valuation thresholds (17× and 15× of approximately $9.27 EPS). None of the two lower numbers is verified chart support. Definitions are non-overlapping: $205 belongs to Watch; $186 Watch; $171 Starter; $158 Accumulation; $140 High-conviction candidate.
Why Qualcomm Fundamentals Matter
| Indicator | Latest verified observation | Interpretation |
|---|---|---|
| Fiscal Q3 revenue | $9.947B; −4% YoY | Overall business weakening near term |
| GAAP / adjusted EPS | $1.87 / $2.21; −23% / −20% YoY | Earnings pressure, not simply multiple compression |
| QCT handset revenue | $5.086B; −20% YoY | Principal cyclical and competitive risk |
| QCT automotive revenue | $1.588B; +61% YoY | Powerful diversification, smaller starting base |
| QCT IoT revenue | $1.830B; +9% YoY | Incremental diversification |
| QCT pretax margin | 26%, lower YoY | Profitability risk |
| Fiscal Q4 guidance | $9.7B–$10.5B sales; adjusted EPS $2.05–$2.25 | Targets to compare with November earnings |
| 9-month operating cash flow | $8.405B vs $10.016B previous year | Cash generation down about 16.1% |
| 9-month capex | $1.578B vs $0.785B | Capital intensity rising |
| 9-month FCF (OCF minus capex) | $6.827B vs $9.231B | Down about 26.0% |
| June 28 cash + marketable securities | $8.304B | Liquidity; includes $4.533B cash |
| June 28 total debt | $15.270B | Net debt roughly $6.966B |
The nine-month free cash flow calculation is $8.405B − $1.578B = $6.827B versus $10.016B − $0.785B = $9.231B in the corresponding prior period. Quarterly cash generation is seasonal, and annualizing these figures would not be a verified normalized FY2027 projection. Increased capital spending and share-based compensation require separate scrutiny.
QCOM Business Quality Scorecard
| Dimension | Grade / reasoning |
|---|---|
| Growth durability | Mixed: handsets −20%; autos +61%; IoT +9% |
| Cash flow | Watch: nine-month FCF −26%; still materially positive |
| Balance sheet | Adequate but leveraged: $8.3B cash/securities vs $15.3B debt |
| Competitive moat | Strong wireless patents/technology; competition and Arm licensing are meaningful |
| Execution | Mixed: diversification working but handset/gross profit pressure |
| Valuation | Fair-to-interesting, not obviously distressed at ~19× forward earnings |
| Technical momentum | Weak: close below 20-day SMA; RSI 44.87; ATR $7.55 |
Overall: quality business, weakening near-term earnings profile. ROIC was approximately 25.6% in the third-party statistics snapshot, but this trailing metric is not a promise of future returns.
Qualcomm Stock Valuation — Verifiable Inputs
At $176.01: third-party quoted trailing EPS $8.59; trailing P/E 20.48×; forward P/E 18.99× (implied rolling forward EPS ≈ $9.27); EV/EBITDA 16.24×; P/FCF 18.04×; FCF yield ≈ 5.54%; P/S 4.26×. Market capitalization ~$187.95B; EV ~$194.92B; shares outstanding approximately 1.07B. These rounded third-party statistics are snapshots, not audited fiscal-2027 consensus disclosures.
Historical forward P/E snapshots: FY2025 14.23×, FY2024 15.74×, FY2023 12.67×, FY2022 9.53×, FY2021 14.87×. Period methodology and earnings expectations vary; these comparisons show that 19× is not an obvious historical bargain. Sector counterparts such as AVGO and NVDA have materially different revenue models and AI growth, so headline P/E comparisons are insufficient without matched forecasts.
| EPS basis | 15× | 17× | 19× | 21× | 23× |
|---|---|---|---|---|---|
| $9.27 rolling implied forward EPS | $139 | $158 | $176 | $195 | $213 |
| $8.59 reported trailing EPS | $129 | $146 | $163 | $180 | $198 |
Price math: multiple × EPS. Example: 17 × ($176.01 / 18.99) = approximately $157.57; 21× = $194.64. These values do not account for changing EPS, discount rates, share count or cash-flow quality.
Bull, Base and Bear — Fiscal Next-12-Month Sensitivity
| Scenario | EPS assumption | P/E assumption | Share value | Interpretation |
|---|---|---|---|---|
| Bear | $8.00 (illustrative) | 15× | $120 | Handset weakness/multiple compression |
| Base | $9.27 (implied estimate) | 19× | $176 | Market broadly pricing current implied estimates |
| Bull | $10.50 (illustrative) | 21× | $221 | Non-handset growth and profitability improvement |
Scenario outcomes relative to $176.01: bear −31.8%; base ~0%; bull +25.3%. No probability is assigned. The $8.00 and $10.50 EPS numbers are illustrative stress cases, not street estimates; the $9.27 is derived from a dated provider forward ratio. Changing EPS by $1 at 19× moves the scenario value by $19/share. Share dilution/buybacks and capital structure require monitoring.
Cash flow cross-check: a third-party P/FCF ratio of 18.04× implies FCF yield of about 5.54%, before growth or taxes. This yield is not a margin of safety by itself while nine-month FCF is contracting. Using the $187.95B rounded equity market capitalization yields a modeled trailing FCF ~$10.42B; it is reverse-engineered from a vendor multiple, not newly audited FCF. Avoid equating it with the nine-month reported FCF.
QCOM Technical Indicators — October 8 Snapshot
| Metric | Value | Signal |
|---|---|---|
| 20-day SMA | $186.23 | Price below: short-term bearish |
| 50-day SMA | $172.63 | Price narrowly above; nearby support candidate |
| 200-day SMA | $169.34 | Longer-term trend floor candidate, not guarantee |
| RSI(14) | 44.87 | Negative momentum, not deeply oversold |
| ATR(14) | $7.55 (~4.3% of close) | Large daily volatility; avoid tight mechanical stops |
| Volume Oct 8 | 9.57M shares | Below recent ~12.5M 50-day norm |
| Resistance | $186–189, then $199–206 | Prior swing highs and short-term moving average |
| Nearby lows | $171.02 then $169 area | Failure changes starter thesis |
Confirmation requires QCOM holding the $169–$173 area and improving relative strength; a sustained recovery through $186–$189 would repair the near-term trend. A high-volume breakdown below $169 or a failed bounce would suspend automatic accumulation. An intraday level is not an exact stop order.
Earnings, Catalysts and Risks
Next reported earnings: November 4, 2026, after market close according to the market-data calendar; reconfirm with Qualcomm IR before relying on schedule. Compare reported Q4 revenue and non-GAAP EPS against management guidance and inspect handset trajectory, QCT margins, automotive, IoT, data center and next-period guidance. Watch stock reaction after the report—not just headline beats.
Catalysts: automotive platforms, industrial/consumer IoT, AI software following the Modular acquisition, data center design wins, wireless royalties and buybacks. These are opportunities, not guaranteed near-term profits. The $40B non-handset revenue ambition for fiscal 2029 is management aspiration, not current sales.
Risks: handset demand, Apple/Samsung competitive transitions, Samsung 2nm foundry execution, China exposure, high memory costs, potentially compressed margins, expanding capex, rates and multiple compression. Arm licensing litigation is active as of October 9; legal outcomes or changed economics could alter the thesis. Do not presume allegations are proven.
Market, Flows, Seasonality and Opportunity Cost
October 8 Nasdaq −1.25%, S&P 500 −0.47%, with reported poor breadth and energy leadership. A semiconductor stock below its 20-day SMA during uneven breadth deserves less aggressive sizing. Historical fourth-quarter strength is context, not a timing signal. The stock’s third-party institutional ownership estimate was 83.3%, but that does not reveal current net buying. A reported September insider sale through a prearranged trading plan is not proof of bearish intent.
Cash and short-duration Treasuries are legitimate substitutes: they offer lower equity risk while the earnings direction is unresolved. Compare any available Treasury yield at execution rather than relying on a stale quotation. Also compare prospective QCOM returns with semiconductor alternatives on the same EPS-growth and FCF basis, not share price or enthusiasm for AI.
Entry Reward/Risk and Execution Controls
The following illustrations use a $195 technical recovery target near the next multiple/structure band and a $140 stress/invalidation marker. $140 is not a guaranteed price floor; a thesis break requires reassessment regardless of price. Reward:risk is arithmetic, not a forecast or success probability.
| Example entry | Target | Stress marker | Upside | Downside | Reward / risk |
|---|---|---|---|---|---|
| $176 | $195 | $140 | +10.8% | −20.5% | 0.53× |
| $165 | $195 | $140 | +18.2% | −15.2% | 1.20× |
| $150 | $195 | $140 | +30.0% | −6.7% | 4.50×* |
*At $150, a $140 stress marker is only $10 away—about 1.3 times the present $7.55 ATR. A high numeric ratio can therefore be misleading: slippage, gaps and changed earnings would dominate. Do not mechanically use $140 as a stop. Avoid new risk immediately ahead of earnings absent an explicit event-risk budget. Portfolio weights, taxable status and cost basis have not been supplied for this article; no invented sizing or tax calculations are made.
Thesis Invalidation and Reassessment
| Trigger | Required OODA response |
|---|---|
| Handset and QCT margins miss guidance again | Lower forward EPS, redo scenarios and zone values |
| FCF deteriorates further while capex expands | Reduce normalized earnings/FCF assumptions; demand larger safety margin |
| Arm litigation materially changes licensing economics | Suspend old thesis until contract impact measured |
| Sustained break below ~$169 with heavy volume | Do not average down on price alone; wait for new base |
| Strong earnings + reclaim of ~$186–189 | Reassess trend and possibly accept shallower starter discount |
OODA — Observe, Orient, Decide, Act
Observe: QCOM −32.28% from May peak; handset sales −20%; auto +61%; reported nine-month FCF −26%; price below 20-day SMA. Orient: Diversification is real but has not eliminated profit pressure; forward valuation ~19× is not indisputably cheap. Decide: Current $176.01 is an unconfirmed starter candidate, not an automatic accumulation buy. Act: Demand stabilization near $169–$173, re-test economics after November earnings and use $158–$171 only when thesis holds. Below $140, reassess before any new capital.
Confidence and Decision Audit
| Gate | Status | What is and is not verified |
|---|---|---|
| Historical quote/range | PASS | October 8 close, intraday low, range and dated chart points |
| Issuer financials / cash flows | PASS | July 29 results and June 28 10-Q; 9-month FCF calculated |
| Technical inputs | PASS with scope | Dated SMA, RSI, ATR, daily swings; no proprietary institutional order flow |
| Valuation | CONDITIONAL | Quoted provider multiples and implied EPS; fiscal-2027 detailed analyst estimates not individually audited |
| Peer valuation | CONDITIONAL | Historical company multiples verified; no normalized matched-peer earnings bridge |
| Capital allocation and flows | CONDITIONAL | Balance sheet/buybacks found; option flows and net institutions unverified |
| Zone validation | CONDITIONAL | Top levels technical; bottom boundaries illustrative earnings multiples, not verified support |
| Recommendation gate | CONDITIONAL | No unconditional purchase recommendation; earnings and market risks explicit |
Research outcome: CONDITIONAL, not PASS. This is a completed research review of the framework, but not a claim that every unknowable input is known. Unknown future estimates, exact fund positioning and litigation outcome remain explicit. These constraints prevent declaring a high-conviction purchase at any current price.
Qualcomm Stock Verdict
WAIT FOR CONFIRMATION OR USE ONLY A SMALL, CONDITIONAL STARTER. A one-third correction is worthy of scrutiny, but business fundamentals, cash generation and the historical forward multiple offer competing signals. Qualcomm could prove a strong recovery investment; the price alone does not establish that outcome. Cash is a position. Don’t buy the dip. Buy the discount.
Sources and Method
- Qualcomm fiscal Q3 2026 results (July 29, 2026)
- SEC Qualcomm 10-Q for June 28, 2026
- Stock Analysis QCOM price and statistics, Oct 8 close
- Stock Analysis QCOM daily prices
- QCOM technical indicators (Oct 8)
- Reuters Oct 9 Arm/Qualcomm litigation
- Reuters Oct 8 market context
Research as-of October 9, 2026, premarket EDT; October 8 regular-session closing quote. Figures labeled illustrative are not independently confirmed forecasts. This educational research is not personalized financial advice. Social preview and live WordPress Rank Math tests remain pending.