

OBORDA / Full OODA Analysis / October 9, 2026
Adobe Stock: 6 Buy Zones and the AI Valuation Test
Adobe Stock is cheap on adjusted earnings—but the market is questioning the durability of those earnings. That tension, not the headline drawdown, determines whether the discount is worth buying.
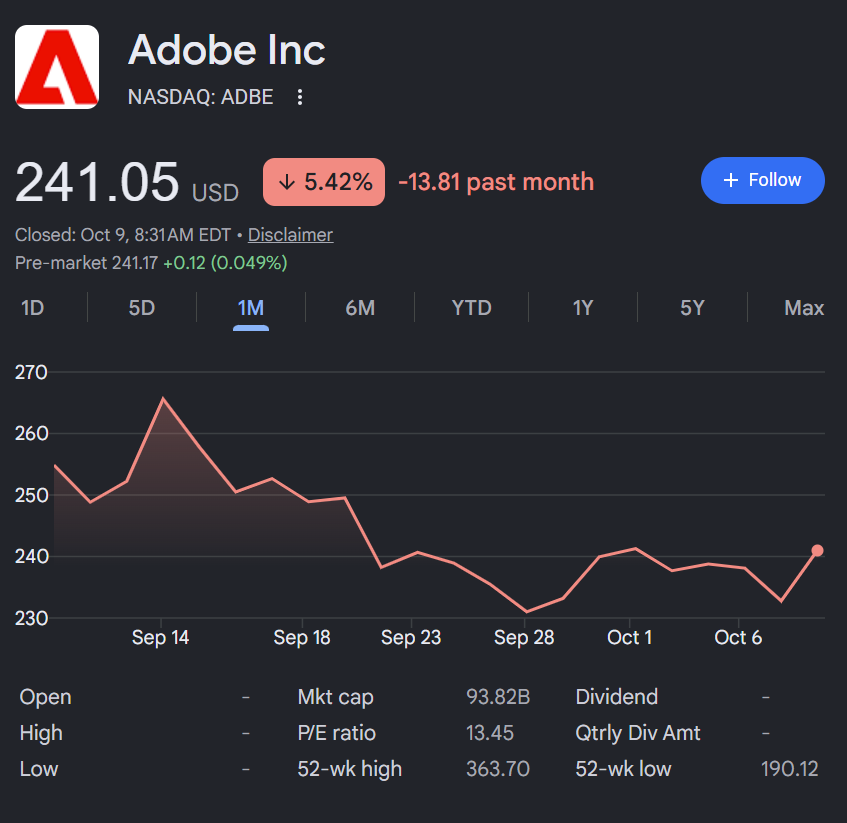
Adobe Inc. (NASDAQ: ADBE) closed October 8, 2026 at $241.05 (not a live October 9 quote). The reported 52-week range was $190.12–$363.70, a -33.7% decline from the high. Historical trading data. Cash is a position; do not buy the dip simply because the chart looks inexpensive.
Data Integrity and Market Snapshot
| Field | Value / classification |
|---|---|
| Exchange / reporting | NASDAQ; USD; standard unadjusted quoted share prices |
| Price observation | October 8 close $241.05; October 9 market was open when this research was compiled. No later intraday quote is treated as a close. |
| 52-week high / low | $363.70 / $190.12 (data-provider historical window) |
| Correction arithmetic | ($241.05 ÷ $363.70 − 1) × 100 = -33.72% |
| Market capitalization approximation | $241.05 × 389.2 million shares (Sept 18 filing share count) = $93.82 billion; approximate, not point-in-time shares |
| Evidence classification | Issuer earnings and SEC 10-Q: reported; 2026 earnings guidance: management estimate; target multiples: illustrative; prices and third-party indicators: provider-reported |
| Research gate | CONDITIONAL: historical/peer multiples, independently reconstructed price indicators, contemporaneous short-interest/options positioning unavailable. |
Adobe Stock: The Market Message
On October 7, ADBE closed at $232.77 on about 6.55 million shares, after a $227 intraday low; October 8 brought a +3.56% rebound to $241.05 on roughly 5.78 million shares. This does not constitute a sustained reversal. ADBE daily price history. Adobe rose October 8 while the S&P 500 fell roughly 0.47%; the one-day divergence does not erase longer-term relative weakness. Market index context.
The September report beat revenue and adjusted EPS expectations, but fourth-quarter revenue guidance landed slightly below consensus midpoint, illustrating that positive operating results can coexist with a negative market reaction. Reuters, September 10. A separate October 8 US PERM immigration-program suspension affecting Adobe is a new operating/legal policy consideration; financial impact has not been quantified. Reuters, October 8.
ADBE Stock Buy Zones: Where Risk/Reward Changes
CONDITIONAL DECISION RANGES, not executable orders. Boundaries are rounded analytical decision points based on the observed $190 / $225–$235 / $243 / $258 technical structure plus FY2026 earnings sensitivity.
| OODA zone | ADBE price | Evidence / required decision |
|---|---|---|
| 🔴 No new buys / Consider trim | Above $295 | Over 12.1× FY26 adjusted EPS; premium needs improving 2027 growth and a breakout beyond the $258 MA cluster. |
| 🟡 Watch | $260–$295 | Above $258 moving-average resistance, but price implies 10.6–12.1× guided adjusted EPS; require successful retest. |
| 🟢 Starter candidate | $235–$260 | Current consolidation $231–$245, below $258 MA resistance; 9.6–10.6× adjusted EPS. Wait for stabilization. |
| 🟢🟢 Accumulation candidate | $215–$235 | Near Sept 28 $224.67 and Oct 7 $227 lows; 8.8–9.6× adjusted EPS with earnings thesis intact. |
| 🔥 High-conviction *candidate* | $190–$215 | Near verified $190.12 yearly low; ~7.8–8.8× adjusted EPS. Requires fresh fundamental confirmation, not a blind order. |
| ⚡ Exceptional / Reassess | Below $190 | Below 52-week low; investigate whether earnings forecasts or software economics have structurally deteriorated. |
Why Each ADBE Boundary Exists
| Boundary | Technical anchor | Valuation / contextual anchor | Required condition |
|---|---|---|---|
| $295 | Above current $258 50/200-day MA cluster; no dated $295 resistance verified | 12.1× FY26 adjusted EPS; 16.3× guided GAAP EPS | Strong FY2027 outlook must justify repricing |
| $260 | Near $257.98 50-day and $257.55 200-day averages | 10.6× guided adjusted EPS | Hold reclaimed averages rather than chase |
| $235 | Inside late September / early October trading cluster, with $231–$239 nearby closes | 9.6× adjusted / 13.0× GAAP FY26 guidance | Base-building and stable AI/ARR |
| $215 | Below Sep 28 $224.67 and Oct 7 $227 local lows; no verified $215 support | 8.8× adjusted / 11.8× GAAP | Extra margin for broken near-term support; thesis intact |
| $190 | Near observed $190.12 52-week low | 7.8× adjusted / 10.5× GAAP | New fundamental assessment before any increased exposure |
| Below $190 | Breach of verified 52-week low | Low multiple may reflect declining future earnings | Re-underwrite rather than average down |
Zone continuity: every dollar falls in one category with thresholds interpreted as $190 / $215 / $235 / $260 / $295; at exact thresholds use the less aggressive category. ATR(14) of about $8.83 (3.7% of price) means narrow limits can be crossed by normal volatility. No price boundary is promised support.
What ADBE Fundamentals Are Telling Me
| Issuer-reported measure | Q3 FY2026 / 9 months | Meaning |
|---|---|---|
| Q3 revenue | $6.760B, +13% YoY | Double-digit growth continuing |
| Subscription revenue | $6.582B, +14% YoY | Recurring-revenue durability |
| GAAP diluted EPS | $4.62 vs $4.18 prior year | GAAP earnings growth |
| Adjusted diluted EPS | $6.13; adjustments material | Must distinguish non-GAAP from GAAP |
| GAAP operating income | $2.354B; 34.8% margin | Operating profitability |
| ARR / RPO | $27.50B ARR / $22.16B RPO | Customer retention/backlog proxy, not guaranteed future revenue |
| 9-month operating cash flow | $7.646B vs $6.871B | +11.3% YoY |
| 9-month capital expenditures | $0.180B | Capital-light infrastructure relative to operating cash flow |
| 9-month FCF proxy | $7.466B = OCF − equipment purchases | Unadjusted FCF; excludes SBC as economic cost |
| Cash + short-term investments | $5.639B at Aug 28 | Liquidity |
| Debt | $6.363B current + long term | ~$0.724B net debt on cash/investments measure |
| 9-month share repurchases | $6.821B cash paid | 26.1M shares delivered; offset by equity compensation |
Adobe targets full FY2026 revenue of $26.576B–$26.626B, GAAP EPS $18.12–$18.17, adjusted EPS $24.45–$24.50, ending ARR growth 10.2%; Q4 revenue target $6.80B–$6.85B. Issuer Q3 release and guidance; 2026 Q3 Form 10-Q.
Business assessment: operationally strengthening, although software moat and margins face AI-driven competitive change. Creative Cloud professional workflows, file compatibility, enterprise contracts and distribution are advantages; lower-cost generative creative tools create substitution and pricing pressure. Stock-based compensation was $1.582B for the first nine months, or ~21% of the FCF proxy, and should not be mistaken for free shareholder value.
ADBE Business Quality Scorecard
| Dimension | Independent evidence | Assessment |
|---|---|---|
| Growth | Q3 revenue +13%, subscription +14% | Strong |
| Cash generation | 9-month FCF proxy $7.466B, SBC $1.582B | Strong cash; SBC dilution cost |
| Margins | GAAP operating margin ~34.8%; FY26 guide 35% | Strong |
| Balance sheet | Cash + investments $5.639B; debt $6.363B | Manageable net debt |
| Recurring moat | ARR $27.5B; AI-first ARR +150% from smaller base | Strong but challenged |
| Execution / capital allocation | $6.821B buybacks; CEO transition; Semrush acquisition | Mixed |
| Valuation | 9.85× guided adjusted EPS; 13.29× GAAP | Attractive but earnings risk |
| Trend / momentum | Price below 20/50/200-day SMA; RSI14 45.47 | Weak |
ADBE Valuation: Adjusted Earnings vs Economic Cash
At $241.05, FY2026 P/E is 9.85× adjusted and 13.28× GAAP, using management midpoints. The spread reflects compensation and other adjustments; the adjusted multiple should not be treated as the only yardstick.
| FY26 adjusted P/E (illustrative) | Implied share price | GAAP EPS comparison |
|---|---|---|
| 7× | $171.33 | 9.4× GAAP |
| 8× | $195.80 | 10.8× GAAP |
| 9× | $220.28 | 12.1× GAAP |
| 10× | $244.75 | 13.5× GAAP |
| 11× | $269.23 | 14.8× GAAP |
| 12× | $293.70 | 16.2× GAAP |
| 14× | $342.65 | 18.9× GAAP |
FCF method: 9-month operating cash flow $7.646B − $0.180B equipment purchases = $7.466B; naïvely annualized × 4/3 = $9.95B. Annualized FCF per September 18 shares ≈ $25.58/share; FCF yield on implied equity value $93.82B is 10.6%. This is a rough run-rate, not formal FY26 forecast; timing, acquisitions, working-capital, tax and stock compensation matter. Subtracting annualized SBC as a simplified sensitivity reduces that proxy by ~$2.11B.
ADBE Bull / Base / Bear Valuation
| Case | Operating premise | Illustrative FY27 EPS | Exit P/E | Share value | From reference |
|---|---|---|---|---|---|
| Bear | AI substitution, slower renewal growth | FY27 illustrative adjusted EPS $20 | 8× | $160 | -33.6% |
| Base | Modest growth; competitive multiple discount | FY27 illustrative adjusted EPS $25 | 10× | $250 | 3.7% |
| Bull | AI monetization protects pricing and margins | FY27 illustrative adjusted EPS $28 | 13× | $364 | 51.0% |
Model math: FY27 modeled adjusted EPS × scenario adjusted P/E = implied stock value ($20×8=$160; $25×10=$250; $28×13=$364). These are author assumptions, NOT management/consensus FY27 forecasts. EPS already embeds shares/financing; do not add net cash again to a P/E value. A 1× P/E change shifts base value by $25; a $1 EPS shift at 10× changes base value $10. Risks include GAAP reconciliation, valuation regimes, stock comp, margin compression and macro rates.
A date-aligned quantitative historical and peer P/E series was not established in the sourced record. Accordingly, these are internal scenario comparisons, not a claim that Adobe is cheaper than every software peer. Direct competitors in creation include Canva/Figma, while Autodesk and Intuit are adjacent recurring-software valuation comparators with materially different economics. Peer-relative superiority is unverified.
ADBE Technical Levels: What Confirms—or Breaks—the Setup?
Archived October 8 technical snapshot: 20-day SMA $243.20, 50-day SMA $257.98, 200-day SMA $257.55, RSI(14) 45.47, MACD line −6.16, ATR(14) $8.83, 20-day Bollinger lower band $225. Technical indicator archive. These vendor readings are not independently reproduced from 200 verified daily bars.
| Technical element | Dated reading | Interpretation |
|---|---|---|
| 20-day SMA | $243.20 | Nearby pivot/resistance |
| 50-day SMA | $257.98 | Intermediate overhead resistance |
| 200-day SMA | $257.55 | Longer-trend resistance |
| RSI14 | 45.47 | Below neutral 50 |
| MACD | −6.16 | Negative momentum |
| Volume comparison | Oct 7 ~6.55M vs reported 50-day avg ~5.0M | Selling pressure with elevated activity |
| ATR14 | $8.83 (~3.7%) | High daily swing risk |
| Swing low / low band | $227 Oct 7 / lower band $225 | Near-term breakdown markers |
| 52-week low | $190.12 | Extreme support reference; may fail |
| Relative strength | Oct 7 lagged S&P 500; Oct 8 outperformed S&P | No durable multiweek RS ranking verified |
Confirmation: consecutive closes above ~$243 then ~$258 with constructive volume and successful retest would strengthen the setup. Failure below $225–$227 shifts focus to lower ranges. A single-day bounce or gap does not confirm a bottom.
ADBE Earnings: The Next Test
Fiscal Q4 earnings release date: not independently confirmed in this research. Recheck the Adobe investor calendar. Watch FY27 revenue/ARR guidance, organic vs acquired growth (including Semrush), AI-first paid retention, GAAP operating margin, share-based compensation, buybacks and post-release price/volume. Guidance revisions override the static zone table.
Sector, Flows, Seasonality and Opportunity Cost
Market classification: 🟡 mixed/rotational. October 8 S&P 500 −0.47%, Nasdaq about −1.3%; leadership concentrated in AI infrastructure while application software faces valuation concerns. Treasury 10-year yields near 5.29% on October 9 increase the discount-rate hurdle for long-duration assets. AP October 8 indexes; Reuters October 9 Treasury yields. Cash and short-duration Treasuries compete with a risky discounted software equity; an adequate premium is essential.
Flow evidence: Adobe repurchased $6.821B during the first nine fiscal months (issuer verified). October 7 heavy volume is consistent with elevated turnover, but cannot identify whether investors were trimming, shorting or rebalancing. Insider trades, verified short-interest trends, options dealer positioning and contemporaneous institutional changes: not established. Seasonality is context only and does not validate a buy zone.
Entry Risk / Reward and Position Controls
| Illustrative entry | Entry | Recovery target | Scenario invalidation | Upside / downside | Reward:risk |
|---|---|---|---|---|---|
| Starter candidate | $245 | $295 | $224 | +20.4% / -8.6% | 2.38:1 |
| Accumulation candidate | $225 | $295 | $189 | +31.1% / -16.0% | 1.94:1 |
| High-conviction candidate | $200 | $295 | $160 | +47.5% / -20.0% | 2.38:1 |
Formula: (target − entry)/(entry − invalidation). Entry $245: (295−245)/(245−224)=2.38:1; $225: 70/36=1.94:1; $200: 95/40=2.38:1. **These are sensitivity calculations, not stop orders or guaranteed outcomes.** $160 represents modeled bear value, not established chart support. Stop-loss gaps may cause greater losses. Size positions from an explicit portfolio loss budget (for example, 0.25%–0.5% risk per idea) and consider aggregate software/AI exposure. No holdings or tax account information is assumed. Taxable-account trimming may trigger capital gains; before earnings, reduce or avoid binary event exposure rather than extrapolate day-to-day ATR.
Catalysts, Competitive Threats and Risks
Catalysts: enterprise Firefly/AI workflow adoption, expansion of monetized AI credits, subscription ARR and user conversion, buyback-related EPS support, lower bond yields, and successful product integration (Semrush/Topaz pending). Some AI optimism is reflected in growth expectations already; what is not verified is the sustained incremental operating profit from AI-first ARR. Timing: FY27 guidance and next earnings are the nearest measurable tests; probabilities and revenue attribution cannot be quantified reliably.
Risks: AI-generated design/content commoditization, competition from Canva, Figma and platform-native tools, margin dilution from model inference cost, high SBC, slowing GAAP EPS quality, CFO/CEO transition, acquisition integration, geopolitical/rate shocks, and October 8 PERM immigration policy uncertainty. The thesis fails if recurring revenue and pricing deteriorate persistently, not just if the share price falls.
Thesis Invalidation and Reassessment Triggers
| Trigger | Evidence to monitor | Response |
|---|---|---|
| Business deterioration | Sequential or YoY ARR deceleration; net new ARR and pricing weaken; guidance repeatedly cut | Suspend adding; rebuild growth/earnings model |
| Cash-flow quality | OCF/FCF weakens or SBC grows faster than underlying economics | Recompute owner earnings / valuation |
| Price breakdown | Sustained losses of $225 and then $190 with heavy volume | Do not presume cheapness; re-underwrite |
| Recovery confirmation | Reclaim $243 then $258 with durable volume | Reassess trend, not chase a single breakout |
| Systemic risk | 10-year yield / credit spreads jump; software ETF remains weak | Demand larger risk premium or hold cash |
| Policy / operations | Quantified staffing impact from PERM restriction | Revise execution-risk premium |
OODA: Observe. Orient. Decide. Act.
Observe: Stock −33.7% from 52-week high; Q3 revenue +13%; 9-month OCF $7.65B; trend below all three monitored SMAs. Orient: Franchise quality is real, but adjusted EPS excludes meaningful compensation and AI may shrink the defensible multiple. Decide: Conditional starter/watch around $235–$260, not high-conviction at current price. Act: Seek stabilization $225–$235 or decisive reclaim of $243/$258; pause after thesis-breaking guidance changes and keep cash as a valid position.
Confidence, Prior Changes and Decision Audit
Confidence: MODERATE for company financial quality; LOW–MODERATE for price timing. The sources are adequate for reported earnings, approximate valuation and dated market structure, but not for peer-relative historical multiples or future customer substitution. The previously proposed $300/$260/$235/$210/$190 boundaries have been freshly challenged and refined to $295/$260/$235/$215/$190 based on the expanded earnings/cash and swing-low review. Prior zones were comparison points, not inputs.
| Research check | Verification | Gate |
|---|---|---|
| Price / high / low / correction | Dated historical quote; arithmetic recomputed | PASS |
| Earnings / guidance / balance sheet | Issuer 8-K press release + 10-Q | PASS |
| Moving averages / ATR / RSI | Dated third-party snapshot; calculation not independently reconstructed | CONDITIONAL |
| Normalized FCF | 9m OCF − capex; annualized proxy and SBC sensitivity disclosed | CONDITIONAL |
| Historical & competitor valuation | Consistent dated multiples not retrieved | HOLD on relative valuation claims |
| Buy zones | Technical observations and management multiples; several outer lines not tested support | CONDITIONAL / non-executable |
| Reward:risk | Illustrative scenario math checked | PASS as scenario only |
| Macro / flows | Index and 10Y verified; detailed options/insider unavailable | CONDITIONAL |
| Publication and SEO | Sources linked; WordPress Rank Math not verified | CONDITIONAL |
Overall publication gate: CONDITIONAL analytical publication only. Suitable as a transparently labeled research note; NOT a fully validated actionable trading plan. External peer/comparable history and independent indicator rebuild remain outstanding.
My Adobe Stock Verdict
Watch / Conditional Starter, not automatic accumulation. Adobe is showing resilient recurring revenue and cash flows, but the market is charging a discount for disruption risk. The risk is not simply a falling price: it is that future earnings may not resemble current adjusted earnings. Better technical confirmation or a verified $215–$235 fundamental discount would improve the case. Cash is a position. Don’t buy the dip. Buy the discount.
Sources and Method
- Adobe Q3 FY2026 SEC 8-K earnings exhibit, Sept 10
- Adobe fiscal Q3 Form 10-Q, filed Sept 22
- ADBE daily close/open/volume history, accessed Oct 9
- October 8 archived technical snapshot
- Reuters September 10 Q3 expectations and reaction
- Reuters October 9 Treasury yields
- Reuters October 8 PERM policy
- AP October 8 index performance
Price as of October 8, 2026 close; compiled October 9, 2026 US Eastern Time. Non-live quote. Guidance is management projection; valuation scenarios and zones are analytical assumptions, not forecasts or promises. Historical/peer valuation, short interest and options flow not verified. Publication gate: CONDITIONAL.