
OBORDA / Investment Analysis / October 9, 2026
Netflix Stock Analysis: 6 Buy Zones Before Q3 Earnings
Is Netflix finally cheap—or is the market correctly repricing slower growth and tougher competition?
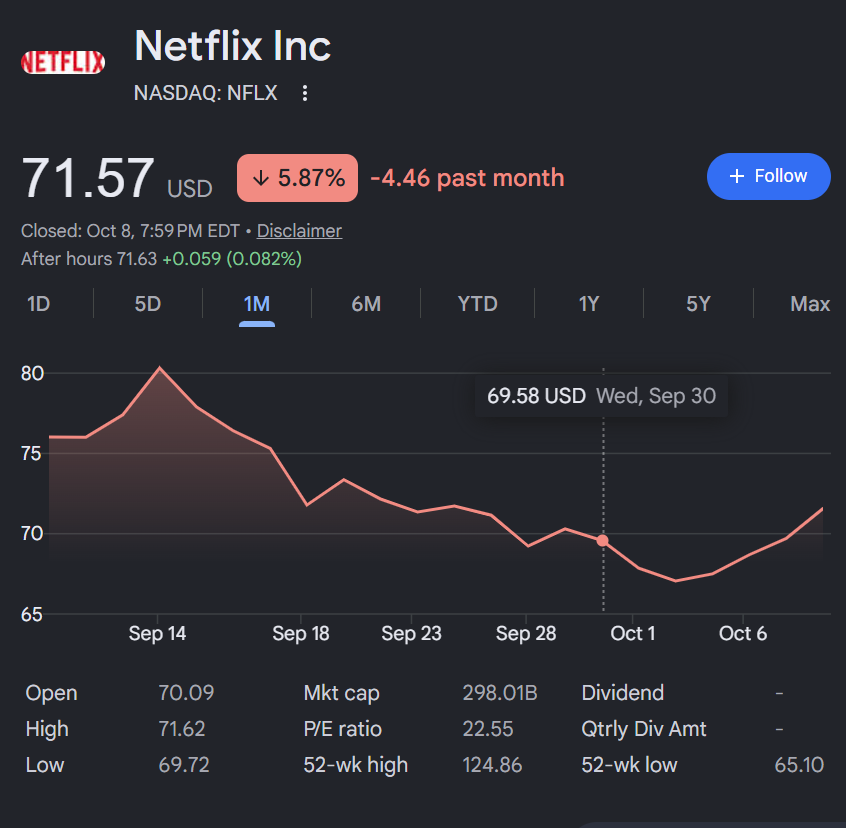
Netflix stock analysis has become much more interesting after a 42.7% decline from the 52-week high. Netflix (NASDAQ: NFLX) closed October 8 at $71.57, compared with a split-adjusted 52-week high of $124.86 and low of $65.08. The arithmetic is simple: ($71.57 ÷ $124.86 − 1) × 100 = −42.68%. But the price decline alone does not settle the valuation question.
That’s the OBORDA discipline: OBserve. ORient. Decide. Act. I don’t need to predict the next trading day. I need decisions that make sense at different prices—and a clear reason to change them when the facts change.
Data Integrity and Market Snapshot
Data status: CONDITIONAL-PASS. Quote type: regular-session close, split-adjusted historical basis. Quote observed: October 8, 2026, 4:00 p.m. EDT; retrieved: October 9, 2026, approximately 2:17 a.m. EDT. Currency: USD. Primary quote source: StockAnalysis / S&P Global Market Intelligence historical data.
Verified close: $71.57; 52-week range: $65.08–$124.86; October 8 volume: 46.13 million; 20-session average volume calculated from the same daily series: 37.32 million, so the session traded at about 1.24× that norm. Market capitalization was about $298.0 billion, with roughly 4.16 billion shares outstanding and a float near 4.13 billion. The stock is about 10.0% above its 52-week low and 42.7% below its high.
Availability limits: the current 20-day and 50-day averages, RSI and ATR below are independently calculated from the dated split-adjusted daily series. A same-date 200-day moving average was not independently verified, so it is marked unavailable rather than guessed. A September 25 third-party reading around $84.71 is treated only as stale context and is not used as a precise current indicator.
Netflix Stock Analysis: The Market Message
NFLX has bounced sharply from its early-October weakness. From the October 2 close of $67.06 to October 8, the stock gained about 6.7%, including a 2.68% rise on October 8. That final session came on above-normal volume while the S&P 500 fell roughly 0.5% and the Nasdaq lost about 1.3%, giving Netflix meaningful short-term relative strength.
But the larger trend is still damaged. The stock remains far below its 52-week high and below the calculated 50-day average. The market’s concern is not that Netflix stopped growing; it is that growth is slowing while competition for attention—especially from YouTube—remains intense. Q2 revenue grew 13.4%, but management guided Q3 revenue growth to 11.7%, and the stock sold off after Q2 because that outlook fell short of expectations.
The current market backdrop is 🟡 Mixed / rotational. Major indexes are near elevated levels, but breadth is uneven, the 10-year Treasury yield is around 5.28%, and the federal funds target range is 3.75%–4.00%. Those yields increase the opportunity cost of paying a premium multiple for slower growth.
NFLX Stock Buy Zones: Where Risk/Reward Changes
These are conditional decision ranges, not guaranteed support or standing buy orders. They combine verified price structure, valuation, business quality, earnings-event risk and margin of safety. Material changes in earnings, guidance, cash flow or market conditions require recalculating the zones.
| OODA zone | Price | Decision |
|---|---|---|
| 🔴 No New Buys / Trim | Above $84 | Major resistance and valuation expansion would compress forward risk/reward. Trim only if valuation, concentration or thesis quality warrants it. |
| 🟡 Watch | $77–$84 | Above the recent 50-day structure but approaching the September $80–$84 supply zone; wait for earnings confirmation or a better discount. |
| 🟢 Starter | $70–<$77 | Valuation is much improved, but the stock has not repaired its intermediate trend and Q3 earnings are close. |
| 🟢🟢 Accumulation candidate | $65–<$70 | Convergence of the July low, recent October support and roughly 19–20× implied forward earnings if the thesis remains intact. |
| 🔥 High conviction candidate | $59–<$65 | Requires intact guidance and no structural engagement break; valuation would move toward the mid-to-high teens on current forward earnings assumptions. |
| ⚡ Exceptional / Reassess | Below $59 | Do not average automatically. A break this deep would require determining whether earnings, engagement, ads, pricing power or the competitive thesis changed. |
Preferred decision at $71.57: Starter / wait-before-earnings, not aggressive accumulation. The stock has rebounded enough that the easy discount at the October low has partially closed, while the October 20 earnings event introduces gap risk. The best current risk/reward improves materially closer to $65–$70.
Why Each NFLX Zone Boundary Exists
These anchors are independently derived for this analysis. Reference corrections are context, not formulas for zone creation.
| Boundary / action | Verified technical anchor | Valuation and margin of safety | Business and market conditions |
|---|---|---|---|
| $84 trim threshold | September highs clustered near $81–$83.60. A stale Sept. 25 200-day reading near $84.71 is context only. | ~24× the current implied forward EPS of ~$3.46 gives about $83. | Would require stronger growth/engagement or a lower-rate backdrop to justify aggressive new buying. |
| $77 watch threshold | Calculated 50-day SMA is ~$75.38; Sept. 15–17 breakdown area sits roughly $75–$78. | 22× implied forward EPS produces about $76. | Price would be improving technically, but the discount would be narrower just as growth decelerates. |
| $70 starter threshold | Current 20-day SMA is ~$72.02; $70 is the recent reclaim area after the Oct. 5 low. | 20× implied forward EPS is about $69.15. | Business remains strong enough for a small position, but Q3 event risk argues against aggressive sizing. |
| $65 accumulation threshold | 52-week low is $65.08; Oct. 5 intraday low was $66.54. | 18× implied forward EPS is about $62.23; $65 begins a more attractive margin-of-safety band. | Requires no material deterioration in Q3 guidance, ads or engagement. |
| $59 high-conviction threshold | Below the verified yearly low; therefore technical confirmation would be weak and fundamentals must carry more weight. | 16–18× implied forward EPS spans roughly $55–$62. | Only high conviction if the decline is multiple compression rather than thesis deterioration. |
| Below $59 reassess | Would represent a decisive new low with no verified support in the current 52-week range. | Would imply a mid-teens or lower multiple on current earnings assumptions. | Requires a full thesis audit before adding: engagement, pricing, ads, content ROI, guidance and competitive position. |
Zone continuity check: no gaps or overlaps by convention: >$84; $77–$84; $70–<$77; $65–<$70; $59–<$65; <$59. Volatility check: calculated 14-day ATR is about $1.83, or roughly 2.6% of the share price, so single-day moves of $1–$2 are normal enough that entries should be staged rather than treated as precision points.
What NFLX Fundamentals Are Telling Me
The business is still strong, but growth is decelerating. Q2 revenue rose 13.4% to $12.56 billion, operating income rose 11% to $4.19 billion, and diluted EPS rose 11% to $0.80. The tension is that operating margin slipped from 34.1% to 33.4%, Q2 free cash flow fell year over year, and Q3 revenue growth guidance slowed to 11.7%.
| Q2 2026 metric | Result | YoY / Context |
|---|---|---|
| Revenue | $12.56B | +13.4% |
| Diluted EPS | $0.80 | +11% |
| Operating margin | 33.4% | 34.1% a year earlier |
| Free cash flow | $1.53B | $2.27B a year earlier |
| Cash & equivalents | $9.10B | June 30, 2026 |
| Debt | $14.31B | Net debt roughly $5.2B before minor adjustments |
Netflix still has meaningful pricing power, global scale, recurring subscription revenue and improving monetization options through advertising and live programming. View hours grew 2% in the first half of 2026, which is positive but not strong enough to end the engagement debate. The company also repurchased about $5.9 billion of stock in the first half of 2026 and had $27.1 billion remaining under its repurchase authorization at June 30.
Management narrowed 2026 revenue guidance to $51.0–$51.4 billion, maintained a 31.5% operating-margin target, expects roughly $3 billion in advertising revenue and approximately $12.5 billion in free cash flow. Q3 guidance calls for $12.86 billion in revenue, 33.2% operating margin and $0.82 diluted EPS.
NFLX Business Quality Scorecard
| Dimension | Evidence | Assessment |
|---|---|---|
| Revenue and earnings durability | Q2 revenue +13.4%; EPS +11%; recurring global membership model | A− |
| FCF and margin quality | 33.4% Q2 operating margin; FCF $1.53B, down from $2.27B | B+ |
| Balance sheet and capital needs | $9.1B cash, $14.3B debt, $25.1B disclosed content obligations | B |
| Moat, pricing power and competition | Global scale and pricing power, offset by YouTube, Disney, Amazon, Skydance and broader attention competition | A− |
| Management execution and capital allocation | $5.9B H1 buybacks; $27.1B authorization remains; active content and ads investment | B+ |
| Valuation against normalized potential | ~20.7× forward P/E versus materially higher 2024–2025 multiples | B+ |
| Technical confirmation and relative strength | Rebound above $70, but still below 50-day SMA and far below 52-week high | C+ |
Overall assessment: B+ / high-quality business with a damaged stock trend. The grade is a judgment summary, not a mechanical recommendation.
NFLX Valuation: A Lower Price Is Not the Same as a Bargain
At $71.57, StockAnalysis reports a trailing P/E around 22.6× and forward P/E around 20.7×. That is a major compression from Netflix’s 2024–2025 valuation profile. The current market price divided by the reported forward multiple implies forward EPS of roughly $3.46 ($71.57 ÷ 20.70). That EPS figure is inferred from the third-party multiple, not management guidance.
Using that inferred forward EPS only as a valuation sensitivity:
| Illustrative forward P/E | Illustrative share value |
|---|---|
| 16× | $55.32 |
| 18× | $62.23 |
| 20× | $69.15 |
| 22× | $76.06 |
| 24× | $82.98 |
This is why the zone structure is not arbitrary. The $65–$70 accumulation area sits near both verified support and approximately 19–20× forward earnings. The $77–$84 watch/trim region requires the market to pay roughly 22–24× while growth is decelerating. The $59–$65 high-conviction candidate zone begins to price Netflix closer to a high-teens multiple—provided the earnings thesis remains intact.
Management’s 2026 free-cash-flow forecast of about $12.5 billion implies a simple FCF yield of roughly 4.2% on the current $298 billion market cap. That is close to the current three-month Treasury yield around 4.22%. Importantly, 2026 cash flow is helped by the Warner Bros. termination fee, so a normalized FCF yield is likely lower than the headline figure. That opportunity-cost comparison argues for requiring a real discount rather than treating $71.57 as automatically cheap.
NFLX Bull / Base / Bear Valuation
Primary methodology: forward P/E because Netflix is profitable, mature enough for per-share earnings analysis, and still expected to grow at a double-digit rate. Forecast horizon: illustrative 2027 earnings power. Source inputs: Q2 2026 company guidance, current third-party forward P/E, and historical/consensus context. The scenarios below are illustrative OBORDA assumptions, not management guidance or guaranteed analyst targets.
| Assumption / outcome | Bear | Base | Bull |
|---|---|---|---|
| Revenue growth | 8–10% | 11–13% | 14–15% |
| Operating margin | ~30% | ~33% | ~35% |
| Illustrative EPS | $3.40 | $3.75 | $4.10 |
| P/E multiple | 16× | 21× | 25× |
| Diluted shares / net cash adjustments | Not separately used in P/E model | Not separately used in P/E model | Not separately used in P/E model |
| Implied share value | $54.40 | $78.75 | $102.50 |
| Return from $71.57 | −24.0% | +10.0% | +43.2% |
Show the calculation: bear = $3.40 × 16 = $54.40; base = $3.75 × 21 = $78.75; bull = $4.10 × 25 = $102.50. Key sensitivity: a one-to-two-turn change in the multiple has a large impact because current yields are high and the market is debating Netflix’s long-term growth rate.
Potential model failures: the P/E framework can mislead if one-time income distorts earnings, buybacks materially change the share count, engagement deterioration forces higher content spending, or advertising scales slower than expected. The WBD termination fee also makes 2026 cash generation unusually difficult to normalize.
NFLX Technical Levels: What Confirms—or Breaks—the Setup?
The verified short-term support cluster is $65–$67: the July 17 low was $65.08 and the October 5 low was $66.54. Immediate resistance is near the calculated 20-day SMA around $72.02. The next important band is $75–$77, where the calculated 50-day SMA (~$75.38) overlaps the September breakdown area. Above that, $80–$84 is the major recovery zone from September swing highs.
The calculated 14-day RSI is approximately 47.5: no longer oversold and not overbought. The 14-day ATR is about $1.83. October 8 volume was about 1.24× the 20-session norm, which gives the rebound more credibility than a low-volume bounce but does not by itself reverse the larger downtrend.
A sustained close above roughly $75–$77 would improve intermediate trend confirmation. A rebound that fails near $72 and then loses $69–$70 would put the $65–$67 support band back in play. A decisive break below $65 should trigger thesis reassessment rather than automatic averaging down.
NFLX Technical Indicator Scorecard
| Indicator | Value and as-of | Interpretation / verification |
|---|---|---|
| 20-day moving average | $72.02, Oct. 8 | Calculated from 20 split-adjusted closes; current price is just below it. |
| 50-day moving average | $75.38, Oct. 8 | Calculated from 50 split-adjusted closes; intermediate trend remains below this level. |
| 200-day moving average | Current value unavailable | Not guessed. Sept. 25 third-party reading near $84.71 is stale context only. |
| RSI (14) | 47.5, Oct. 8 | Calculated from the same daily series; neutral momentum after the rebound. |
| Volume vs 20-day norm | 1.24× | 46.13M volume versus 37.32M 20-session average. |
| ATR / volatility | $1.83 / ~2.6% | Calculated 14-day Wilder ATR; supports staged entries. |
| Relative strength vs sector | Weak longer-term, improving short-term | NFLX remains 42.7% below its 52-week high while the Communication Services sector index is only about 7% below its yearly high. |
| Gaps / support / resistance | $65–67 support; $72, $75–77, $80–84 resistance | Derived from dated price history and calculated moving averages. |
Technical confirmation trigger: reclaim and hold $75–$77 on healthy volume. False-breakout contingency: a quick rejection back below $69–$70 after testing resistance would weaken the rebound. Unavailable indicators remain unavailable; they are not inferred from a single close.
NFLX Earnings: The Next Test
Netflix has confirmed that it will release Q3 2026 results on October 20, 2026, at about 1:01 p.m. Pacific Time. Management’s existing Q3 forecast is $12.86 billion revenue, 11.7% year-over-year growth, 33.2% operating margin and $0.82 diluted EPS.
The most important confirmation points are not merely whether Netflix beats a quarterly EPS estimate. I want to see whether revenue growth stabilizes, whether ads remain on track for roughly $3 billion in 2026, whether pricing changes continue to hold without damaging churn, whether engagement commentary improves, and whether management can sustain margin expansion into 2027.
Sector, Flows and Opportunity Cost
Communication Services itself is not in distress, which makes NFLX’s large drawdown more company-specific than sector-wide. The broader market is mixed: October 8 produced a Nasdaq decline of roughly 1.3%, while Netflix gained 2.68%. At the same time, the 10-year Treasury yield near 5.28% creates a high hurdle for long-duration growth valuations.
Institutional ownership is about 83% according to current third-party share statistics. Netflix itself has been a meaningful buyer of its stock: it repurchased about $5.9 billion in the first half of 2026 and retained $27.1 billion of authorization at June 30. I am not attributing the 2026 decline to shorts, institutions or options flows because no current evidence here proves a specific selling cause.
Seasonality is not used as a buy or sell signal. The more relevant opportunity cost is that three-month Treasuries yield around 4.22%, while Netflix’s headline 2026 FCF yield is roughly 4.2% before adjusting for the one-off WBD termination fee. That means investors should demand growth and execution—not merely a lower stock price—to justify equity risk.
Entry Risk / Reward and Position Controls
Targets and invalidation levels are conditional analytical inputs, not predictions. Reward:risk = (scenario target − entry) ÷ (entry − invalidation), calculated only when target > entry > invalidation.
| Potential entry | Base target | Invalidation | Upside / downside | Reward:risk | Execution rule |
|---|---|---|---|---|---|
| $73 starter | $79 | $64.50 | +8.2% / −11.6% | 0.71× | Small only; poor pre-earnings asymmetry. |
| $67.50 accumulation | $79 | $59 | +17.0% / −12.6% | 1.35× | Stage entries; require intact Q3 thesis. |
| $62 high-conviction candidate | $79 | $54 | +27.4% / −12.9% | 2.12× | Only if business evidence remains strong; no automatic averaging. |
Sizing and concentration: personal position size was not provided for this public article, so no personalized allocation is assumed. A starter before earnings should be smaller than a normal full position because of gap risk. Loss budget: price-only invalidation is not the same as a broken business thesis; earnings gaps can pass through technical levels. Taxes and liquidity: account type and tax basis are not assumed; NFLX liquidity is ample for normal retail execution.
Event guardrails: Q3 earnings are October 20, so avoid treating the current rebound as confirmation before the report. Opportunity cost: cash and short-duration Treasuries currently offer meaningful nominal yield, so waiting is a legitimate action if NFLX stays above the preferred accumulation zone.
What Could Go Right—and What Could Go Wrong?
Catalysts: advertising scaling toward ~$3B in 2026; live programming and sports inventory; continued pricing power; strong international engagement; programmatic ad-tech improvements; content licensing arrangements such as the recent Disney deal; ongoing buybacks; and any evidence that engagement growth is reaccelerating. Some of this is already expected, so catalysts need to beat the market’s current assumptions, not merely occur.
Risks: revenue growth dropping into the high single digits; YouTube taking more viewing time; ad monetization scaling slower than expected; price increases raising churn; content spending rising faster than monetization; margin compression; high Treasury yields suppressing valuation multiples; and a Q3 report that confirms rather than resolves the engagement concern.
Thesis Invalidation and Reassessment Triggers
| Trigger | What would change | Required OODA response |
|---|---|---|
| Revenue/engagement deterioration | Growth falls materially below guidance or engagement weakens with rising churn | Stop averaging; rebuild valuation and zones. |
| Margin/FCF deterioration | 31.5% FY margin target or ~$12.5B FCF framework breaks without a compelling reinvestment explanation | Lower fair-value multiples and require wider margin of safety. |
| Technical breakdown | Decisive close below $65 followed by failure to reclaim support | Treat lower zones as reassessment points, not automatic buys. |
| Market/rate shock | Treasury yields rise further or risk assets enter broad stress | Compress acceptable multiple and preserve cash. |
Next scheduled recheck: October 20, 2026 Q3 earnings. Unscheduled recheck: material guidance revisions, major content/ads changes, a break below $65, or a rapid move into the $80–$84 resistance region. Falling into a lower zone does not authorize averaging down after thesis invalidation.
OODA: Observe. Orient. Decide. Act.
Observe: NFLX closed at $71.57, 42.7% below its 52-week high but nearly 10% above its 52-week low after a four-session rebound. Q2 fundamentals remain strong, but growth has slowed and the Q3 guide is the next major test.
Orient: valuation is dramatically more reasonable than it was at the highs, but the stock is still below the 50-day average, rates are high, and the headline FCF yield is not obviously superior to cash once the one-time WBD termination fee is considered.
Decide: current price is a Starter, not an aggressive accumulation. The preferred accumulation range is $65–$70. High conviction begins only below $65 if the business thesis remains intact.
Act: do not chase the rebound into $75–$77 before earnings. If buying before October 20, keep it small. Add more aggressively only if price returns to $65–$70 with intact fundamentals, or if post-earnings confirmation materially improves the growth/engagement outlook. Reassess below $59 rather than automatically averaging down.
Confidence, Prior Changes and Decision Audit
Confidence: Moderate. Fundamental quality, valuation compression, buybacks and verified support near $65–$67 are supportive. Offsetting factors are slowing growth, unresolved engagement competition, high rates, the October 20 earnings event and the unavailable same-date 200-day moving average.
Compared with the October 5 OBORDA analysis: the prior framework placed $63–$70 in accumulation and $70–$76 in starter. This analysis was rebuilt from current data rather than carrying those zones forward. After the rebound to $71.57, updated valuation math, verified moving averages and the approaching earnings event, the new structure shifts accumulation to $65–$70, starter to $70–$77, high conviction to $59–$65, and reassess to below $59. The change is evidence-driven, not a requirement to remain consistent with the prior article.
| Audit check | Evidence / calculation | Status |
|---|---|---|
| Quote, 52-week range and timestamp | Oct. 8 close $71.57; $65.08–$124.86; split-adjusted S&P Global series | PASS |
| Latest company filings, earnings, guidance | Q2 10-Q and shareholder letter; Q3 date confirmed by Netflix IR | PASS |
| Technicals and dated levels | MA20, MA50, RSI14, ATR14 and volume calculated from 50-session series; current MA200 unavailable | CONDITIONAL |
| Valuation math and scenarios | Forward P/E source + explicitly inferred EPS; bull/base/bear assumptions labeled illustrative | PASS |
| Zone uniqueness and anchors | No overlaps/gaps; boundaries tied to support, MAs and valuation bands | PASS |
| Risk/reward and invalidation | Explicit starter/accumulation/high-conviction R:R calculations and event guardrails | PASS |
| Markets, flows and opportunity cost | Fed rates, Treasury yields, market action, buybacks and institutional ownership; no unsupported short-selling claim | PASS |
| Source links, SEO and privacy | Primary filing links included; no personal share counts/account values; Rank Math package supplied separately | PASS |
Overall publication gate: CONDITIONAL-PASS. The article is publishable with current sourced price/fundamental data and auditable zones, but the October 20 earnings event is close enough that all actionable levels should be recalculated immediately after the report. The current 200-day moving average is intentionally not presented as verified.
My Netflix Stock Analysis Verdict
STARTER / WAIT FOR BETTER ASYMMETRY. Confidence: Moderate. Netflix is a much more attractive business at $71.57 than it was near $125, but the stock has already rebounded from the October low, growth is decelerating, and the risk-free opportunity cost is high. The current price is reasonable for a small starter, while $65–$70 offers the better accumulation setup and $59–$65 becomes high conviction only if Q3 confirms that the business—not just the share price—remains intact.
The important change is that Netflix is no longer being priced for perfection. But a lower multiple is not automatically a bargain when the market is debating the correct long-term growth rate.
Cash is a position. Don’t buy the dip. Buy the discount.
Sources and Method
- Netflix Q2 2026 Shareholder Letter / SEC Exhibit 99.1 — July 16, 2026
- Netflix Form 10-Q for quarter ended June 30, 2026 — filed July 17, 2026
- Netflix Q3 2026 earnings announcement — September 14, 2026
- NFLX historical prices — S&P Global Market Intelligence via StockAnalysis, updated October 8, 2026
- NFLX statistics and valuation — StockAnalysis, October 2026
- Federal Reserve H.15 selected interest rates — October 8, 2026
- Reuters U.S. market report — October 8, 2026
- Reuters on Disney licensing content to Netflix — October 2, 2026
- Netflix Ads update in Japan — October 8, 2026
Data snapshot: October 8, 2026 regular-session close; research retrieved October 9, 2026 approximately 2:17 a.m. EDT. U.S. cash market was closed at retrieval time. Price history is split-adjusted. MA20, MA50, RSI14, ATR14 and 20-session average volume were calculated from the cited daily price series. Current 200-day MA was not independently verified and is not used as a precise anchor. Valuation scenarios are illustrative. Research/publication gate: CONDITIONAL-PASS. Buy zones are conditional—not forecasts or guaranteed returns. Reassess when material earnings, valuation or market evidence changes.