
OBORDA / Investment Analysis / October 9, 2026
SPCX Stock Analysis: 6 Buy Zones After a 28.8% Correction
SPCX stock analysis starts with a question: How much of a discount is enough when a remarkable business still trades at an extraordinary valuation?
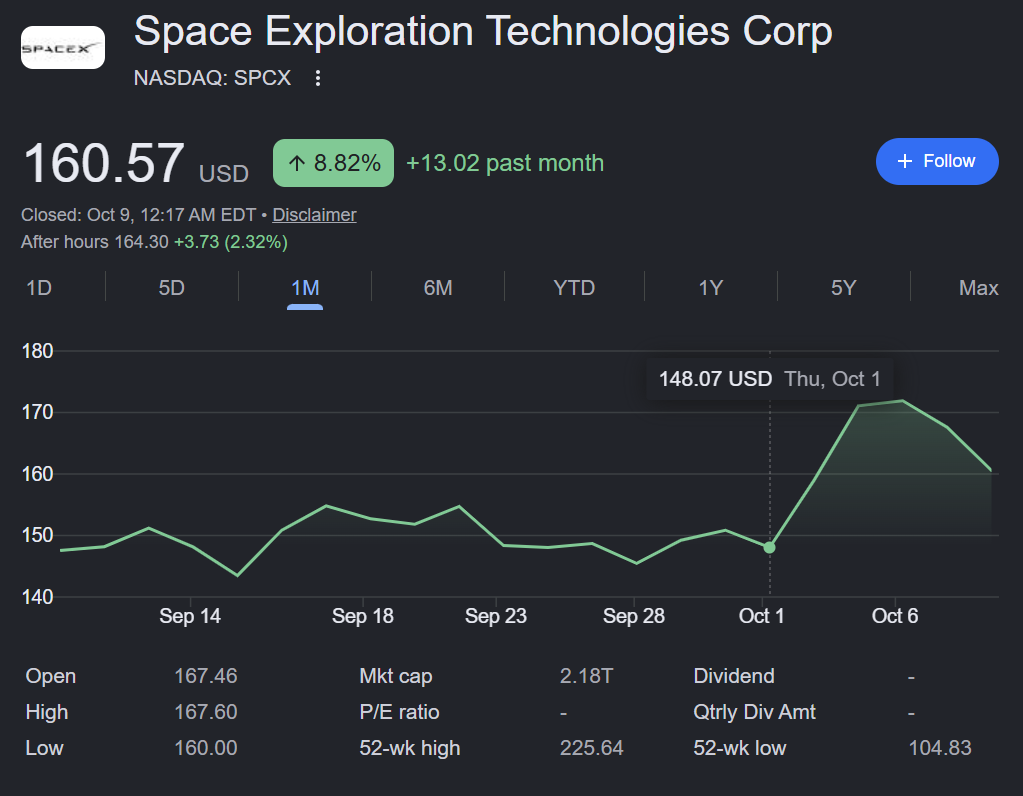
Space Exploration Technologies Corp. (SpaceX) closed October 8 at $160.57, down 28.84% from its $225.64 52-week high. A sizable correction earns my attention; it does not automatically earn my capital. I want the business, price structure, valuation and risk to align.
That is the OBORDA discipline: OBserve. ORient. Decide. Act. I am not trying to predict tomorrow’s price. I am defining what evidence would justify acting at different prices.
SPCX Stock Analysis: The Market Message
On October 8, SPCX fell 4.19% from $167.60 to $160.57 on approximately 71.8 million shares. The previous two sessions followed a sharp rally: October 1 closed at $148.07, October 6 at $171.92, and October 8 back near $160. The rally is being tested, not yet conclusively broken.
The S&P 500 and Nasdaq also declined October 8, but SPCX’s larger loss points to greater sensitivity. News about an approximately $8 billion spectrum acquisition reinforces its Starlink Mobile ambitions; funding requirements for AI infrastructure and the IPO share-supply calendar simultaneously increase uncertainty. 🟠 Defensive / rotational is my market classification for this decision.
SPCX Stock Buy Zones: Where Risk/Reward Changes
These are conditional decision ranges, not price forecasts, guaranteed support or standing buy orders. They combine the recent chart, the IPO offering-price reference, and forward sales-multiple sensitivity. At the October 8 close, the stock is in Watch—not an automatic starter.
| OODA zone | Price | Decision |
|---|---|---|
| 🔴 No New Buys / Trim | Above $180 | Reassess valuation, gains and concentration |
| 🟡 Watch — current | $155–180 | Avoid chasing; breakout-retest range |
| 🟢 Conditional Starter | $145–155 | Require stabilization near September base |
| 🟢🟢 Accumulation candidate | $130–145 | IPO price and 50-day average; recheck financing |
| 🔥 High conviction candidate | $110–130 | Only with sustained growth and credible returns |
| ⚡ Exceptional / Reassess | Below $110 | Near historical low; investigate impairment |
My preferred range for investigating a modest first position is $145–155, but only if price stabilizes and the financing and earnings outlook remain intact. Below $145, valuation improves materially; that does not mean a broken thesis should be averaged down. High conviction is conditional on evidence, never on correction size alone.
What SpaceX Fundamentals Are Telling Me
The operating story is strong, but the cash-flow story is difficult. SpaceX’s Q2 2026 revenue increased 92% year over year, driven by connectivity, space services and AI. Yet capital expenditures are far above current operating cash generation.
| Q2 2026 metric | Reported result | Context |
|---|---|---|
| Revenue | $7.81B | +92% YoY |
| Net result | −$541M | GAAP loss |
| Adjusted EBITDA | $3.54B | +191% YoY |
| Connectivity revenue | $4.29B | Strong subscriber expansion |
| AI revenue | $2.56B | High capital intensity |
| Cash and securities | ~$100B | Large liquidity reserve |
| Six-month operating cash flow | $3.47B | Positive |
| Six-month capital expenditures | $28.48B | Very high |
| Six-month simplified FCF | −$25.01B | Operating cash flow less capex |
The company’s six-month simplified free cash flow was roughly negative $25.01 billion ($3.47 billion operating cash flow less $28.48 billion of capital expenditures). Connectivity has established meaningful scale and operating profitability. Launch capability offers durable strategic advantages. AI could become a major engine, but the cost of expanding infrastructure presents a central investment risk.
SpaceX reported about $100 billion in cash and securities and about $39.7 billion in total debt. Liquidity is substantial, but so is the investment program. New financing, future dilution, and actual returns on capital matter more than revenue growth alone.
SPCX Valuation: Is the Correction a Discount?
At $160.57, reported market capitalization was about $2.18 trillion. The trailing P/E is not meaningful because of losses. The reported forward P/E near 103×, trailing P/S near 94.6× and forward P/S near 25.55× indicate exceptionally demanding expectations. Forward figures are estimate-dependent, not guaranteed company results.
For auditability, the sensitivity table below holds the October 8 forward-sales estimate and share count constant while varying only the stock price. It demonstrates valuation compression, not intrinsic value.
| SPCX price | Implied forward P/S | Discount from $160.57 |
|---|---|---|
| $180 | 28.6× | Premium |
| $160.57 | 25.55× | Baseline |
| $155 | 24.7× | −3.5% |
| $145 | 23.1× | −9.7% |
| $130 | 20.7× | −19.0% |
| $110 | 17.5× | −31.5% |
At $145, even the unchanged-forecast forward sales multiple remains above 23×; at $130, approximately 21×. Thus a price decline of 19% from here would still not produce a conventional low valuation. Morgan Stanley’s bullish growth-adjusted thesis depends on future profit expansion; the bearish case is that capital spending and financing costs absorb too much of that expansion.
SPCX Technical Levels: What Confirms—or Breaks—the Setup?
| Price region | Observed anchor | Implication |
|---|---|---|
| $171–176 | October 5–6 rally highs | Resistance / reclaim test |
| $158–160 | October 2 breakout and Oct 8 low | Immediate test |
| $149–155 | Late-September / early-October base | Conditional starter |
| $142–146 | September lows and 50-day MA ~$143.23 | Support / momentum test |
| $135 | IPO offering-price reference | Valuation and sentiment reference |
| $104–110 | Post-IPO low ~$104.83 | Re-underwrite thesis |
The reported 50-day moving average is $143.23 and RSI is 56.88. The October 8 volume of ~71.8 million was below the reported 20-day average near 94.8 million. With the IPO only occurring in June 2026, a 200-day moving average and a robust public-market seasonality record are unavailable.
A sustained recovery through $171–176 would repair momentum but reduce the discount. Losing $149 would increase the likelihood of testing the $142–146 base. A break toward the IPO price or historical low would trigger fundamental reassessment, not indiscriminate buying.
SPCX Earnings: The Next Financial Test
The next earnings date is estimated for November 17, 2026; treat that as a market-calendar projection until confirmed by the company. I will focus on Starlink operating profits, AI revenue relative to capex, free cash flow, outstanding financing needs, and management’s guidance.
Strong earnings followed by sustained selling may reveal that excellent results were already priced in. Conversely, a muted reaction to disappointing news may suggest pessimism was embedded in the shares. The market’s response helps orient the next decision; it does not replace analysis.
Sector, Flows, Seasonality and Opportunity Cost
SPCX crosses several categories: space launch, satellite telecom, government services and AI infrastructure. Its public trading history is too short for meaningful long-term seasonal conclusions. October volatility matters less than valuation, debt markets, lockup events and earnings.
Reported short interest was roughly 162.25 million shares, or 7.27% of float, with approximately 2.07 days to cover. A reported ARK Invest reduction of 54,873 shares illustrates institution-level profit-taking; it is not proof that institutional holders as a group are leaving. IPO lockup releases can contribute supply, but their price effect cannot be assumed.
Higher Treasury yields increase the opportunity cost of owning long-duration growth expectations. For new capital, SPCX competes against profitable technology companies, diversified equity exposure and cash/Treasuries. I do not give SPCX priority merely because it has corrected substantially.
What Could Go Right—and What Could Go Wrong?
Catalysts: Starlink Mobile expansion via low-band spectrum, recurring satellite connectivity, improving launch economics as Starship matures, government and defense business, enterprise AI monetization, and stronger evidence of operating leverage.
Risks: Valuation compression, high AI capital expenditure, financing or dilution, launch execution, spectrum approval, telecom competition, institutional repositioning, IPO unlock-related supply, and the risk that reported growth does not produce sustainable returns on invested capital.
Why the zones are conditional: The attractive-looking $110–130 area would still represent a high forward revenue multiple. It becomes high conviction only if future cash generation, margins and business resilience validate the thesis. Price alone will not do that.
SPCX Risk/Reward: A Scenario Test
These price levels are illustrative 12–24-month outcomes, not analyst targets or probability-weighted forecasts. They test what a purchaser would gain or lose under different business and valuation outcomes.
| Scenario | Illustrative price | Return from $160.57 | Driver |
|---|---|---|---|
| Bull | $240 | +49.5% | Rapid monetization and strong multiples |
| Base | $175 | +9.0% | Continued growth; muted rerating |
| Bear | $115 | −28.4% | Multiple compression |
| Stress | $90 | −44.0% | Financing or growth deterioration |
At $160.57, a $240 bull scenario offers about 49.5% upside against approximately 28.4% downside to $115: an illustrative upside/downside ratio of 1.7:1. At $140, the same endpoints produce roughly 71.4% upside versus 17.9% downside, or about 4:1. These ratios are mechanical; they do not measure the likelihood of either outcome.
OODA: Observe. Orient. Decide. Act.
Observe: SPCX is down 28.84% from its high, has retreated from its early-October rally, and remains above the reported 50-day moving average. Revenue growth is exceptional, while free cash flow remains substantially negative.
Orient: SpaceX has considerable competitive advantages in launch and satellite communications, with optionality from AI and mobile connectivity. Nevertheless, the equity still prices extraordinary future progress amid major investment and financing requirements.
Decide: At $160.57, Watch / wait is more appropriate than aggressive entry. The $145–155 range is a conditional starter, and $130–145 warrants investigation for staged accumulation if the thesis remains intact.
Act: Watch the $158–160 retest, the $149–155 base, the $142–146 deeper support area, the IPO lockup calendar, financing announcements, and the next earnings report. Rebuild the valuation assumptions if estimated revenues, share count, capex or profitability change.
My SPCX Stock Analysis Verdict
WATCH / NO AGGRESSIVE NEW BUY. Confidence: Moderate in the valuation caution; lower in exact entry timing. SPCX may be an exceptional company without being an exceptional investment at the current price. Its growth creates opportunity; its valuation and cash needs demand a larger margin of safety.
There is a material difference between getting a lower price and receiving a genuine discount.
Cash is a position. Don’t buy the dip. Buy the discount.
Sources and Method
- SEC — SpaceX Q2 2026 earnings release
- SEC — SpaceX June 2026 Form 10-Q
- Stock Analysis — SPCX statistics, valuation and short interest
- Stock Analysis — SPCX price and volume history
- Investing.com — October 8 close and 52-week range
- MarketWatch — Growth-adjusted bullish valuation thesis
- Investor’s Business Daily — ARK portfolio adjustments
Data snapshot: October 8, 2026 US market close; prepared October 9 before regular trading. After-hours indication was approximately $164.30 at 7:59 p.m. EDT and is not a regular-session close. Prices are not live. Forward multiples and scenario endpoints are assumptions or analyst estimates; zones are conditional, not guaranteed returns. Update the framework after changes to earnings, valuations, supply and market conditions.