
OBORDA / Investment Analysis / October 9, 2026
IBM Stock Analysis: 6 Buy Zones After a 31.8% Correction
IBM stock analysis starts with an uncomfortable question: After a 31.8% correction, am I looking at a discount—or a business that deserves a lower valuation?
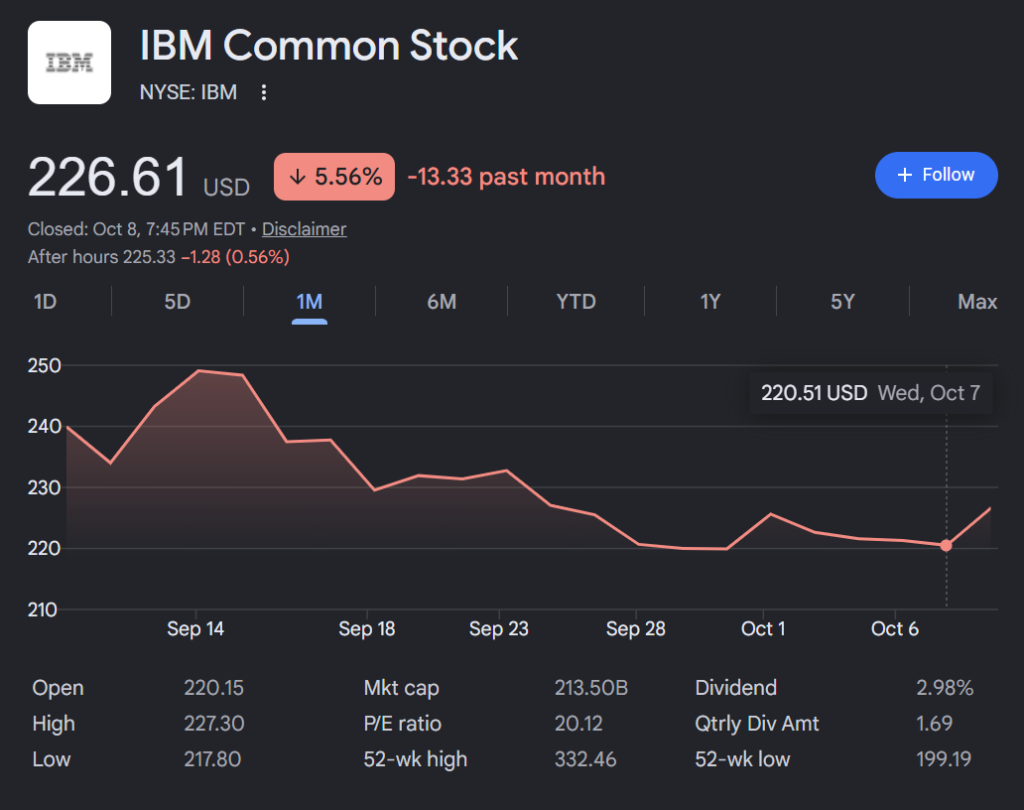
International Business Machines closed October 8 at $226.61, down from a 52-week high of $332.46. That’s a significant repricing. But the size of the decline does not settle whether IBM is attractive. I want the earnings, cash flow, chart structure and price paid to align.
That’s the OBORDA discipline: OBserve. ORient. Decide. Act. I don’t need to predict the next trading day. I need decisions that make sense at different prices—and a clear reason to change them when the facts change.
IBM Stock Analysis: The Market Message
On October 8, IBM gained 2.77% as the S&P 500 declined 0.47%. Trading volume was approximately 8.6 million shares, versus a recent 50-day average near 5.7 million. IBM outperformed a weak technology tape, but one strong session does not establish a lasting reversal.
The bigger story began in July. IBM released disappointing preliminary second-quarter numbers on July 14, revealing weaker software and infrastructure execution. The subsequent reported quarter showed 1% total revenue growth, with software up 5%, consulting flat and infrastructure down 7%. The stock’s weakness was not merely the market indiscriminately selling technology.
IBM’s 52-week low is $199.19. Its latest close remains below prior trading levels near $232–255. The broader environment is 🟡 mixed/rotational, with elevated yields and uneven technology-sector sentiment. The October 8 rebound gets my attention; it does not command my capital.
IBM Stock Buy Zones: Where Risk/Reward Changes
These are conditional decision ranges, not guaranteed support or standing buy orders. They combine historical price structure with an illustrative earnings-multiple model. A deterioration in earnings or cash-flow expectations would require recalculating every zone.
| OODA zone | Price | Decision |
|---|---|---|
| 🔴 No New Buys / Trim | Above $255 | Reassess extension, thesis and concentration |
| 🟡 Watch | $235–255 | Recovery and overhead resistance; don’t chase |
| 🟢 Starter — current | $220–235 | Only modest exposure ahead of earnings |
| 🟢🟢 Accumulation candidate | $205–220 | Better valuation if guidance remains intact |
| 🔥 High conviction candidate | $190–205 | Require fresh fundamental confirmation |
| ⚡ Exceptional / Reassess | Below $190 | Investigate thesis damage before buying |
My preferred area to investigate additional new capital is $205–220, provided the thesis is intact. This sits around recent support and approximates 16–17 times the base-case earnings assumption explained below. I would not label $190–205 a high-conviction purchase based on price alone.
What IBM Fundamentals Are Telling Me
IBM’s second-quarter results show two different stories. Software—including Red Hat and data software—continues to provide resilient growth. But infrastructure weakness, flat consulting and falling quarterly free cash flow prevent me from describing the overall business as uniformly strong.
| Q2 2026 metric | Result | YoY |
|---|---|---|
| Total revenue | $17.2B | +1% |
| Software revenue | $7.8B | +5% |
| Consulting revenue | $5.3B | Flat |
| Infrastructure revenue | $3.8B | −7% |
| Operating EPS (non-GAAP) | $2.93 | +5% |
| Quarterly free cash flow | $2.54B | −11% |
| Total debt, including financing debt | $62.0B | Meaningful |
Red Hat grew 11% and data software grew 19%, while IBM Z fell 42%. IBM ended the quarter with about $8.2 billion in cash and securities. Its enterprise relationships, software switching costs and hybrid-cloud position are important advantages, but acquisition spending and debt complicate the capital-allocation picture.
Management’s updated full-year outlook calls for 4–5% constant-currency revenue growth and about $1 billion more free cash flow than 2025. The next report must show whether that improvement is attainable.
IBM Valuation: A Lower Price Is Not the Same as a Bargain
At $226.61, IBM trades around a high-teens forward P/E, depending on the earnings estimate and data provider. That is meaningfully less demanding than its earlier premium valuation, but it’s not a distress multiple for a mature company experiencing uneven growth.
For consistency, I use an illustrative $12.80 forward EPS base case below. This is a model assumption for sensitivity analysis, not IBM management’s earnings guidance or a guaranteed consensus estimate.
| Forward EPS multiple | Illustrative share value |
|---|---|
| 15× | $192.00 |
| 16× | $204.80 |
| 17× | $217.60 |
| 18× | $230.40 |
| 20× | $256.00 |
This explains the zone construction. Around $220–235, the implied multiple is approximately 17.2–18.4× the assumption. At $205–220, that falls to roughly 16–17.2×. At $190–205, it approaches 14.8–16×. Those discounts help only if expected earnings do not deteriorate.
Cash flow matters too. IBM’s second-quarter free cash flow slipped, and debt remains substantial. Elevated Treasury yields increase the opportunity cost of owning an uncertain equity recovery. The discount must compensate for those risks; I will not rely on P/E alone.
IBM Technical Levels: What Confirms—or Breaks—the Setup?
$218–220 is the immediate area to watch after repeated late-September and early-October tests. Below that, the post-July selloff range and the $199.19 annual low become relevant. Higher resistance appears around $232–235, then $240–255.
The October 8 bounce came with elevated volume, which is constructive. Still, IBM has been trading below important medium- and longer-term moving-average areas. I want stronger price structure—not a single session—to demonstrate a reversal.
Below $205, some of the analysis shifts from observed price support to valuation sensitivity. A break under $199, particularly alongside reduced guidance, would be a warning to reassess rather than automatically average down.
IBM Earnings: The October 21 Test
IBM has announced its third-quarter results conference call for October 21, 2026, at 5:00 p.m. ET. The earnings release is expected ahead of the call. That report may matter more than any short-term technical bounce.
My questions are straightforward: Is software growth stabilizing or accelerating? Does Red Hat remain resilient? Are infrastructure results recovering? Can management preserve its full-year free-cash-flow target? And does the stock rise or fall after investors hear the guidance?
Sector, Flows and Opportunity Cost
On October 8, the Nasdaq declined approximately 1.25% while IBM advanced. That is short-term relative strength, not proof that institutional investors have rebuilt a long position. Strong trading volume can reflect several kinds of flows, including repositioning and short covering; without corroborating ownership and options data, I won’t claim to know which.
For capital allocation, IBM competes with stronger-growth technology businesses, other mature cash generators, and simply holding cash or Treasuries. It must offer a better expected return for the risk taken. Market seasonality and a 30% correction are useful context—but neither constitutes a buy signal.
What Could Go Right—and What Could Go Wrong?
Catalysts: Sustained Red Hat and data-software growth, adoption of IBM’s enterprise AI tools, hybrid-cloud modernization, consulting stabilization, productivity improvement, and stronger cash flow. IBM’s quantum research could have strategic long-term value, but I do not assign it a near-term profit contribution without evidence.
Risks: Further enterprise-spending pressure, disappointing software deals, prolonged infrastructure weakness, acquisition-integration costs, debt, weaker cash generation and high interest rates. A disappointing October 21 report could invalidate the assumption that a low-$200s stock price represents value.
OODA: Observe. Orient. Decide. Act.
Observe: IBM is down 31.84% from its high. October 8 brought a high-volume rebound, but the company is still dealing with the aftermath of disappointing operating results.
Orient: IBM retains meaningful enterprise software advantages, although its overall financial results are mixed. A lower valuation is justified to a degree by weaker growth and execution risk.
Decide: At $226.61, IBM qualifies for a conditional starter, not aggressive accumulation. The more attractive investigation range is $205–220 if the forward thesis survives the October earnings report.
Act: Track $218–220 support, the $232–255 recovery area, October 21 guidance and free cash flow. If already invested, consider position concentration, cost basis and opportunity cost before adding. Rebuild the valuation ranges if estimates change.
My IBM Stock Analysis Verdict
HOLD / CONDITIONAL STARTER. Confidence: Moderate on valuation and business quality; lower on near-term entry timing. IBM’s valuation has improved significantly, but the upcoming earnings event, uneven growth, debt and incomplete recovery pattern argue for discipline.
The drop is large enough to investigate. It is not enough to justify conviction.
Cash is a position. Don’t buy the dip. Buy the discount.
Sources and Method
- IBM official Q2 2026 earnings release (July 22)
- IBM July 14 preliminary results and CEO letter (SEC)
- IBM official October 21 earnings announcement
- IBM October 8 price and 52-week range
- IBM historical price, support and volume
- October 8 IBM price action and volume (MarketWatch)
- October 8 broader market conditions (Reuters)
Data snapshot: October 8, 2026 after the US market close; prepared October 9 before the next trading session. Prices are not live. The forward EPS assumption is illustrative, and buy zones are conditional—not forecasts or guaranteed returns. Reassess whenever earnings, valuation or market evidence changes.