

OBORDA / Investment Analysis / October 14, 2026
WDC Stock Buy Zones: 6 Key Levels After a 52% Drop
Western Digital has lost more than half its value from its 52-week high. Is the market offering a discount—or warning investors that the price of success got too high?
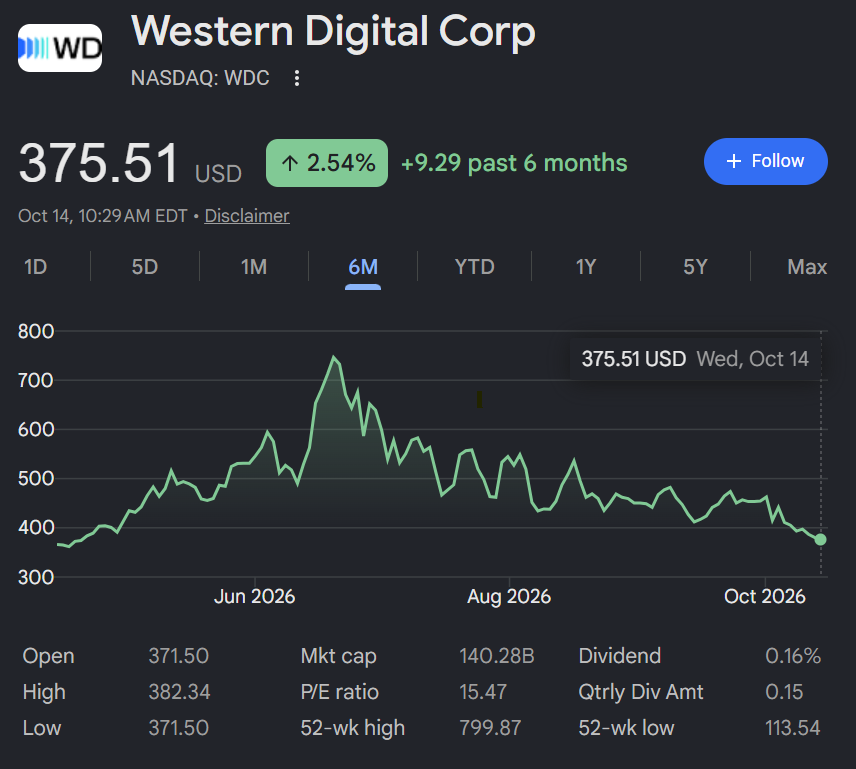
WDC stock closed October 13 at $380.71, down 52.4% from its $799.87 June high. That is a serious correction. It is also not, by itself, a reason to buy. The question is what today’s price buys in future earnings, free cash flow, and competitive advantage.
This is where OBORDA applies OBserve. ORient. Decide. Act. Not to predict tomorrow’s price, but to identify where the risk/reward starts making sense.
WDC Stock Buy Zones: Where Risk/Reward Changes
These six conditional decision ranges combine recent price structure, earnings sensitivity, competitive risk, and margin of safety. They are not automatic orders. If the business outlook changes, the zones change.
| OODA zone | Price | Decision |
|---|---|---|
| 🔴 No New Buys / Trim | Above $475 | Reassess valuation and concentration near prior swing resistance. |
| 🟡 Watch | $430–475 | A rebound is not a discount without earnings support. |
| 🟢 Starter | $390–430 | Small entry only with stabilization and improving evidence. |
| 🟢🟢 Accumulation candidate | $355–390 | Deeper discount; demand intact earnings and technical confirmation. |
| 🔥 High conviction candidate | $315–355 | More upside for intact earnings; not high conviction if guidance breaks. |
| ⚡ Exceptional / Reassess | Below $315 | Rebuild the valuation and determine why the stock fell. |
At $380.71, WDC is inside the accumulation-candidate range—not an unconditional buy. I want the discount and evidence that the earnings power behind it remains durable.
Observe: What Is the Market Saying About WDC?
On October 2, WDC fell roughly 10.2% on nearly 24.8 million shares, following reports that Toshiba intends to expand hard-drive production capacity. Toshiba’s investment could challenge the supply discipline and strong pricing enjoyed by the major HDD producers. The market is asking whether today’s exceptionally attractive margins can last.
The October 5 rebound to $441.64 did not hold. Shares subsequently slid to $380.71 on October 13. That day’s intraday low of $358.26 is an observable area of buying interest, not confirmed long-term support.
The pressure is also occurring in a more defensive, rotational market for technology and AI-adjacent stocks. But WDC’s HDD competition concern is distinct from headlines about Chinese DRAM-chip competition: hard drives and DRAM are not the same business.
Orient: The Business Is Stronger Than the Stock Chart
Western Digital’s latest reported fiscal quarter, ended July 3, shows why investors should not confuse price weakness with immediate operating deterioration.
| Fiscal Q4 2026 | Reported |
|---|---|
| Revenue | $3.75B, +44% YoY |
| Non-GAAP gross margin | 54.4% |
| Non-GAAP diluted EPS | $3.56 |
| Free cash flow | $1.28B |
Demand for economical, high-capacity cloud storage remains a legitimate growth driver. Western Digital is producing real cash, expanding margins, and serving major hyperscale customers. On the latest reported numbers, the business is strengthening.
But good results do not answer whether those margins are sustainable. Toshiba’s planned capacity expansion introduces an important future supply risk, even if current demand and customer arrangements limit the near-term impact.
WDC Valuation: Is a 52% Correction Enough?
Not automatically. One reason to be careful is accounting quality: Western Digital’s recent GAAP earnings include substantial non-operating gains associated with its Sandisk stake. Those gains should not be confused with recurring profits generated by selling hard drives.
Consider an illustrative normalized annual EPS range of $16–$20. At 22 times earnings, those assumptions imply approximately $352–$440 per share. At 18 times $18 EPS, the implied value is $324. These are scenarios, not consensus estimates or guaranteed fair values.
Management’s fiscal Q1 2027 guidance midpoint is $4.00 non-GAAP EPS. Simply annualizing that quarter gives $16, but the HDD cycle and product mix can make quarterly annualization unreliable. At the October 13 close, $380.71 divided by that illustrative $16 run rate is about 23.8×.
That is the tension: strong growth can support a premium, but a cyclical manufacturer needs a margin of safety if pricing power weakens. The stock is dramatically cheaper than its peak; it is not necessarily cheap against normalized earnings.
Why These Six Boundaries?
$475: Near the September 23 swing high of $475.66. This is an identifiable technical resistance and a point to reassess upside versus valuation.
$430: Near the October 5 rebound structure, where a recovery stalled below $448. Buyers would still face overhead supply.
$390: Around several early-October trading levels and recent breakdowns. Reclaiming it would be an initial improvement, not a confirmed new uptrend.
$355: Near the October 13 intraday low of $358.26 and the illustrative $352 valuation at $16 EPS × 22×. This is the most tangible intersection of market structure and valuation in the lower zones.
$315: A more conservative valuation-sensitive boundary near the $324 scenario at $18 EPS × 18×. It is not a verified historical support level, so conviction here depends on the earnings thesis surviving.
Below $315, an extreme discount requires a fresh business assessment. The rule is simple: lower prices do not repair a broken investment thesis.
The October 22 Earnings Test
Western Digital is scheduled to report fiscal Q1 2027 results after the closing bell on October 22, 2026. Existing company guidance calls for $4.0–$4.2 billion revenue, 55%–56% non-GAAP gross margin, and $3.85–$4.15 non-GAAP EPS.
The report matters for more than whether WDC beats the quarter. I will be looking for evidence that hyperscaler demand, storage pricing, supply commitments, margins, and free cash flow can remain strong despite planned industry capacity additions.
A strong quarter followed by further selling might mean investors still consider the valuation demanding. A weak result with a constructive price reaction could suggest bad news was already reflected. In both cases, guidance and the market’s response matter more than the headline EPS number alone.
Flows, Catalysts and Risks
Reported short interest as of September 30 was approximately 18.29 million shares, or 4.9% of float, up 5.9% from the prior reporting period. That does not establish a coordinated short attack or explain the entire decline. Short interest is one signal, not the thesis.
The bullish path: Cloud and AI storage demand remains robust, higher-capacity products gain adoption, long-term customer commitments help preserve pricing, and WDC sustains strong cash generation.
The bearish path: Expanded industry supply pressures pricing, hyperscalers moderate capital spending, normalized margins fall, or earnings estimates prove too optimistic. Elevated interest rates and weaker technology-sector appetite can amplify a valuation reset.
Seasonality is context—not a buy signal. Cash remains an alternative while the company approaches a consequential earnings report.
Decide: Is WDC Worth Buying Here?
Here is the practical answer. WDC is worth watching closely, but I do not need to rush into a full position at $380. The business is performing, yet price momentum remains damaged and the next guidance update is only days away.
To stress-test the decision, consider three illustrative 6–12-month outcomes: a $500 bull case (25% weight), $400 base case (45%), and $280 bear case (30%). The weighted terminal value is approximately $389, only 2.2% above the $380.71 reference close. The weights are judgmental assumptions, not measured probabilities. Their purpose is to test whether risk is being compensated—not to predict an exact outcome.
At $330, holding those same scenario values constant would imply roughly 17.9% expected price appreciation. But that improvement matters only if a further price drop is not caused by worse fundamentals.
Act: The OBORDA Plan
Observe: WDC has corrected 52.4%, with an unusually sharp October breakdown and weak follow-through after a rebound.
Orient: Revenue, margins, and cash generation are strong. Competitive capacity and normalized valuation are the central uncertainties.
Decide: Watch / conditional accumulation. Favor a smaller, confirmed entry over buying aggressively just because the stock is down.
Act: Monitor whether WDC holds and builds above the $355–360 area, reclaims $390–415, and confirms its earnings outlook on October 22. Recalculate zones immediately if management changes the forward margin or demand thesis.
My WDC Verdict
Confidence: Moderate in the business assessment; lower in the precise timing of the entry. The strength of the latest financial results is clear. The market has not yet proved that the decline is over or that today’s growth margins are permanent.
WDC offers something worth watching: a powerful underlying business at a dramatically lower stock price. But the correction is an invitation to do the math, not permission to stop doing it.
Cash is a position. Don’t buy the dip. Buy the discount.
Sources and Method
- Western Digital, fiscal Q4 and FY2026 financial results (August 5, 2026)
- Western Digital, earnings date announcement (October 8, 2026)
- ChartExchange, WDC historical daily OHLC and volume
- MarketBeat, WDC short-interest reporting as of September 30, 2026
- MarketWatch, Toshiba capacity news and HDD industry response (October 2, 2026)
Research snapshot: October 14, 2026. Reference price: October 13 regular-session close, not a live October 14 quote. Earnings scenarios and probabilities are illustrative. Buy zones are conditional research judgments; lower valuation boundaries are not all confirmed chart-support levels. Reassess after earnings and material market or company developments. Publication research status: CONDITIONAL.