
OBORDA / Investment Analysis / October 9, 2026
Spotify Stock: 6 Buy Zones Ahead of October Earnings
Spotify is growing listeners, subscribers and margins—but is a rebound after a near-25% retreat already a discount worth buying?
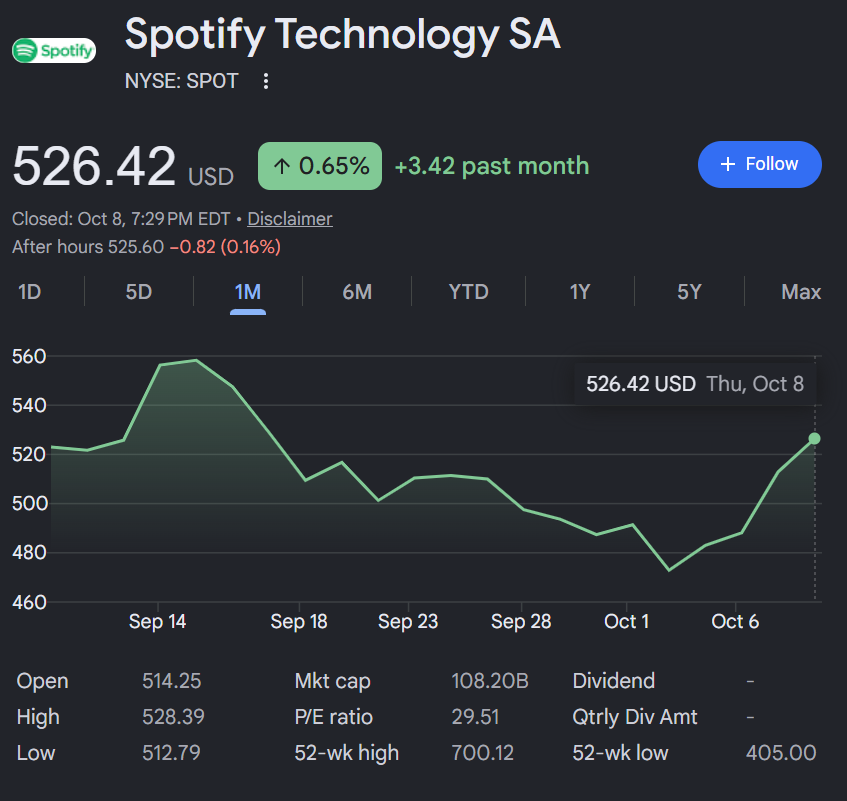
Spotify Technology S.A. (SPOT) closed October 8, 2026 at $526.42, compared with a 52-week high of $700.12 and low of $405.00. The change from the high is −24.81%. The drawdown is real, but the company still commands a substantial forward earnings and cash-flow multiple.
That’s the OBORDA discipline: OBserve. ORient. Decide. Act. I don’t need to predict the next trading day. I need decisions that make sense at different prices—and a clear reason to change them when the facts change.
OCT 8 CLOSE
$526.42
FROM 52-WEEK HIGH
−24.81%
OODA POSITION
🟡 Watch / do not chase
Data Integrity and Market Snapshot
Data status: CONDITIONAL — financial and quote inputs verified; some technical, flow and scenario assumptions remain limited. Quote type: NYSE regular-session close, not a live or after-hours quote; USD, unadjusted close. Quote observed: October 8, 2026, 4:00 p.m. EDT; retrieved: October 9, 2026, early EDT; pages checked for analysis. Currency: USD share price; issuer reports in EUR. Sources: StockAnalysis historical prices.
52-week $405.00–$700.12; October 8 volume 1,656,299 vs 20-day average 1,444,188; estimated equity market cap $108.22bn and 205.58m shares outstanding (market-data aggregator; the $108.22bn cap is as reported). Issuer Q2 results are reported in EUR; US market ratios and balance-sheet conversions are third-party estimates; future models below are illustrative, not company guidance. ($526.42 − $700.12) ÷ $700.12 × 100 = −24.81%.
Availability limits: 20-day moving average, ATR and options positioning were not independently validated. Historical peer-multiple alignment and management Q3 guidance details were not fully established. These limitations lower conviction..
Spotify Stock: The Market Message
October 8 SPOT rose 2.63% on 1.66m shares (about 1.15× its published 20-day average); the Nasdaq fell about 1.3% and S&P 500 about 0.5%. That is one-day relative outperformance, not proof of a lasting leadership trend.
SPOT advanced from its October 2 close of $472.89 to $526.42 (about +11.3%) in four trading sessions. The move coincides with improved business data and a previously enlarged buyback authorization, but these facts do not establish why particular holders bought or sold.
The stock remains materially below its 52-week high, yet above published 50- and 200-day averages. The broader market is 🟡 mixed/rotational with narrow participation. The extent of stock-specific versus macro-driven selling cannot be isolated from available flow data.
SPOT Stock Buy Zones: Where Risk/Reward Changes
These are conditional decision ranges, not guaranteed support or standing buy orders. They combine verified technical structure, valuation, business quality, and margin of safety. Material changes in earnings, guidance, cash flow or market conditions require recalculating the zones.
| OODA zone | Price | Decision |
|---|---|---|
| 🔴 No New Buys / Trim | Above $585 | Consider trimming only on extension, earnings disappointment, or excessive portfolio weight; $585 is near an illustrative premium valuation threshold. |
| 🟡 Watch | $515–585 | Avoid chasing the rebound: forward valuation and near-term earnings risk offer limited cushion. |
| 🟢 Starter | $490–515 | Small, conditional starter near 50/200-day mean-reversion cluster; demand price stabilization. |
| 🟢🟢 Accumulation candidate | $455–490 | October $470 swing low and reduced multiple; add only if earnings and margins hold. |
| 🔥 High conviction candidate | $405–455 | Approaches the $405 52-week low; substantial discount but thesis confirmation is mandatory. |
| ⚡ Exceptional / Reassess | Below $405 | Breaking the 52-week low requires a fresh model and investigation, not automatic averaging down. |
Decision: WATCH at $526.42; no new full-size purchase before earnings. The $515 line is close to the $516.45 published 50-day average; $490–500 brackets the $498.94 200-day average; $470–490 corresponds to October swing support; $405 is the published 52-week low. The $585 extension line is a valuation/overhead-supply judgment rather than verified resistance.
Why Each SPOT Zone Boundary Exists
These anchors are independently derived for this analysis. Reference corrections are context, not formulas for zone creation.
| Boundary / action | Verified technical anchor | Valuation and margin of safety | Business and market conditions |
|---|---|---|---|
| $585 | Not verified as chart resistance; valuation-derived extension | ~34× illustrative $17.20 EPS ≈ $585 | Trim only with excess concentration or deteriorating return potential |
| $515 | 50-day MA $516.45 | Approximately 30× illustrative $17.20 EPS | Wait for Oct 22 earnings confirmation |
| $490 | 200-day MA $498.94; Sep/Oct $485–500 trading area | ~28–29× illustrative $17.20 EPS | Small only after base formation |
| $455 | October 2 low $470.51 precedes this lower safety margin | About 26.5× illustrative $17.20 EPS | Must check deterioration if $470 fails |
| $405 | 52-week low $405 | About 23.5× illustrative $17.20 EPS | Not high conviction merely because price is low |
| Below $405 | Break of 52-week low | Rebuild scenario after break | Breakdown below 52-week low: reassess fundamentals, not an automatic purchase |
Zone continuity check: Use exact boundaries: below 405; 405≤P<455; 455≤P<490; 490≤P<515; 515≤P≤585; above 585.. Volatility check: ATR not verified. Beta 1.61 and Oct 7 $33.05 intraday range suggest meaningful entry/gap risk; do not over-size..
What SPOT Fundamentals Are Telling Me
Strengthening operationally: Q2 2026 paid subscribers reached 300m (+9% y/y), MAUs reached 777m (+12%), revenue increased 14% and gross margin hit a 33.4% high. This does not remove financial-market valuation risk.
| Q2 2026 / TTM June 2026 metric | Result | YoY / Context |
|---|---|---|
| Revenue | €4.8bn Q2 | +14% y/y (+15% constant currency) |
| Earnings / EPS | €655m Q2 operating income | Q2 issuer figure; reported trailing EPS aggregated by data provider is $18.19, affected by unusual tax/accounting items |
| Operating margin | 33.4% Q2 gross margin | +193 basis points y/y |
| Free cash flow | €3.267bn TTM to June 2026 | vs €2.872bn FY 2025 (not a like-for-like year-over-year comparison) |
| Cash and equivalents | $7.98bn third-party translated market dataset | Latest available TTM/balance-sheet snapshot; company statements denominated in EUR |
| Debt / net debt | $0.53bn third-party translated data | Net cash approximately $7.45bn as reported by market aggregator; FX/data definitions may vary |
Premium subscription recurring revenue and global distribution are strengths; music royalties and platform competitors restrain pricing leverage. Q2 MAU growth exceeded subscriber growth; watch conversion and average revenue per user. Digital operations keep capex low, though content and product costs matter.
The next earnings event is listed for October 22, 2026 (before market open). Detailed Q3 management outlook/revisions were not independently established for this edition; require that report to confirm subscriber growth, advertising trends and margin trajectory.
SPOT Business Quality Scorecard
| Dimension | Evidence (source/period) | Assessment |
|---|---|---|
| Revenue and earnings durability | 300m paid (+9%); 777m MAUs (+12%); Q2 revenue +14% | Strong |
| FCF and margin quality | TTM €3.267bn FCF; Q2 gross margin 33.4% | Strong, tax normalization caveat |
| Balance sheet and capital needs | Market-data estimate of $7.45bn net cash | Strong |
| Moat, pricing power and competition | Category scale, recommendation/discovery, subscriptions; content licensing limits economics | Moderate–strong |
| Management execution and capital allocation | Q2 margin high and Aug 20 $1.5bn buyback increase | Positive, buyback not executed in full |
| Valuation against normalized potential | 34.60× forward EPS; 29.51× trailing FCF per market data | Demanding |
| Technical confirmation and relative strength | Price $526.42 above 50-day $516.45 and 200-day $498.94 | Improving, volatile |
Overall assessment: High-quality operating franchise; valuation and near-term event risk prevent a high-conviction entry. Grades are judgment summaries, not a mechanically averaged recommendation.
SPOT Valuation: A Lower Price Is Not the Same as a Bargain
At the October 8 close, third-party measures show trailing P/E 28.94×, forward P/E 34.60×, P/FCF 29.51× and FCF yield 3.39%. Forward P/E exceeding trailing P/E warns against extrapolating trailing accounting earnings. Peer and Spotify-history multiple comparisons lack aligned dates here and are not asserted.
For interpretability we illustrate a 12–18-month normalized EPS of $17.20, NOT management guidance or consensus. The market-data forward P/E implies about $15.21 EPS ($526.42/34.60). Choose the company-appropriate primary metric (EPS, EBITDA, sales, or FCF); do not mechanically use P/E for loss-making companies.
| Illustrative × normalized $17.20 EPS | Illustrative share value |
|---|---|
| 23.5× | $404.20 |
| 26.5× | $455.80 |
| 28.5× | $490.20 |
| 30× | $516.00 |
| 34× | $584.80 |
Example: $17.20 × 28.5 = $490.20 (starter threshold near the 200-day trend); ×26.5 = $455.80 (deeper accumulation boundary); ×23.5 = $404.20 (roughly the 52-week low). Multiples are scenario choices, NOT market-validated intrinsic values.
TTM €3.267bn FCF vs USD equity cap $108.22bn needs FX conversion; the vendor’s directly reported USD P/FCF 29.51× avoids mixing currencies. FCF includes stock compensation and working capital changes; compare expected equity return with available Treasury yield before deploying cash.
SPOT Bull / Base / Bear Valuation
Primary methodology: Illustrative normalized EPS × forward exit multiple, cross-checked against P/FCF; appropriate for profitable subscriptions, but sensitive to taxes and content economics. Forecast horizon: 12–18 months, not a guaranteed target date. Source inputs: Published $526.42 Oct 8 share close; forward P/E 34.60× (market aggregator Oct 9); scenario EPS assumptions in USD. Figures below are illustrative unless explicitly identified as published management guidance or dated consensus estimates.
| Assumption / outcome | Bear | Base | Bull |
|---|---|---|---|
| Revenue / unit growth | slower subscriber/ads +5–7% | subscriber ~9%; revenue 10–13% | subscriber double digits; advertising/ARPU improves |
| Margins / unit economics | gross margin stagnates; operating leverage weak | margin advances modestly | margin expansion exceeds baseline |
| EPS / EBITDA / FCF (period, units) | $13.00 illustrative normalized EPS | $17.20 illustrative normalized EPS | $20.00 illustrative normalized EPS |
| Multiple / yield / discount rate | $27× | $34× | $38× |
| Diluted shares / net cash adjustments | Per-share EPS already incorporates share count; no EV bridge | Per-share EPS already incorporates share count; no EV bridge | Per-share EPS already incorporates share count; no EV bridge |
| Implied share value | $351.00 | $584.80 | $760.00 |
| Return from observed price | -33.3% | +11.1% | +44.4% |
Show the calculation: Bear $13 × 27 = $351; base $17.20 × 34 = $584.80; bull $20 × 38 = $760. All USD/share. EPS model is illustrative; not a cash-flow discount model.. Key sensitivity: Every 1× exit multiple changes base value by $17.20/share; every $1 EPS changes base value by $34/share..
Comparison: Published 3-year revenue growth forecast 13.91%, EPS growth 23.01% (third-party snapshot). Matched historical and peer series were not verified, so a claimed relative discount would be misleading.. Potential model failures: Trailing profit includes tax effects; earnings forecasts, royalty agreements, compensation, share dilution and FX can materially shift modeled fair value..
SPOT Technical Levels: What Confirms—or Breaks—the Setup?
Oct 2 intraday low $470.51; Oct 7 intraday $485.06–$518.11; Oct 8 high $528.39. Near-term reclaim is the $515–530 area; a sustained move above $530 could test the September $545–565 supply region. These are historical prices, not guaranteed support.
Market-data snapshot: 50-day $516.45, 200-day $498.94, RSI(14) 55.83, 20-day average volume 1.444m. Current 20-day MA not independently verified. The $526.42 close exceeds both stated longer moving averages.
Failure to hold $515 with follow-through through $500 shifts focus to the October $470 area. A break of $405 with weakening fundamentals invalidates automatic bargain labeling.
SPOT Technical Indicator Scorecard
| Indicator | Value and as-of | Interpretation / verification |
|---|---|---|
| 20-day moving average | Unavailable | Do not estimate from single quote |
| 50-day moving average | $516.45 (vendor snapshot October 9) | Price $526.42 is above; verify next session |
| 200-day moving average | $498.94 (vendor snapshot October 9) | Price above long-term average |
| RSI (14) / momentum | 55.83 (vendor snapshot October 9) | Momentum constructive, not extreme |
| Volume vs 20-day norm | 1.656m / 1.444m = 1.15× | Oct 8 volume modestly above 20-day average |
| ATR / volatility | Unavailable | Use smaller sizing because Oct 7 intraday spread $33 |
| Relative strength vs benchmark/peer | Oct 8 SPOT +2.63% vs Nasdaq −1.25% | One-day relative outperformance only |
| Gaps, support, resistance, failed breaks | Oct 2 low $470.51; Oct 8 high $528.39 | Near-term $500, $515, $530 and $470 landmarks |
Reclaim and retain $530 after results, ideally with above-normal volume. A reversal below $500 negates the fast-rebound interpretation.. Unavailable indicators must remain explicitly unavailable; they cannot be inferred from a single close.
SPOT Earnings: The Next Test
October 22, 2026 before market open (market-data calendar lists confirmed). Assess Premium net adds, MAU-to-paid conversion, ad demand, revenue/ARPU, gross and operating margins, FCF, FX and executed repurchases.
Strong results plus a sustained price hold above the 50-day average would support the rebound; strong results met by selling could indicate expectations were already too high.
Sector, Flows and Opportunity Cost
🟡 Mixed/rotational: Oct 8 S&P −0.47%, Nasdaq −1.25%, with reported narrow breadth. SPOT belongs to Communication Services; compare future relative strength with XLC, Nasdaq and streaming/advertising peers, without asserting a verified full-period peer spread here.
Vendor lists 4.52m shares short (~2.20% outstanding; ~2.88% float), a modest short base, and institutional ownership ~67.84%; these are snapshots, not proof of short-driven selling. No current options/institutional transaction attribution is asserted.
October earnings season can amplify gaps; calendar patterns alone have no predictive authority. Compare SPOT’s earnings yield and expected growth with cash, Treasury bills and other high-quality businesses; avoid paying a premium merely to stay invested.
Entry Risk / Reward and Position Controls
Targets and invalidation levels are conditional analytical inputs, not predictions. Reward:risk = (scenario target − entry) ÷ (entry − invalidation), calculated only when target > entry > invalidation.
| Potential entry | Base target | Invalidation | Upside / downside | Reward:risk | Execution rule |
|---|---|---|---|---|---|
| $500 | $584.80 | $455 | +17.0% / -9.0% | 1.88:1 | Only a small exploratory position after stabilization |
| $470 | $584.80 | $405 | +24.4% / -13.8% | 1.77:1 | Stagger exposure; require intact earnings thesis |
| $425 | $584.80 | $351 | +37.6% / -17.4% | 2.16:1 | Potentially compelling only if a new fundamental review passes |
Sizing and concentration: Unknown; investor must check existing Communication Services exposure and correlated positions.. Loss budget: Illustrative risk is entry less invalidation per share; actual overnight earnings gaps may exceed assumed loss.. Taxes and liquidity: Account, taxes and lot-specific holding period not supplied; do not assume tax-free rotation..
Event guardrails: October 22 earnings are roughly two weeks from this publication; prefer waiting for results or keep pre-event position exploratory.. Opportunity cost: No verified current T-bill yield or tax-adjusted comparison here; holding cash avoids binary event loss while keeping optionality..
What Could Go Right—and What Could Go Wrong?
Catalysts: Continued Premium adoption, ad monetization, audiobooks/podcasts, subscription mix, better margins and authorized ~$2.223bn buyback. Some optimism is embedded in ~34.6× forward earnings; an authorization is not a guaranteed purchase.
Risks: Royalty/label terms, pricing resistance, weaker ad sales, competition, AI/product execution, FX, multiple compression, weaker free cash flow and post-earnings gap losses. Persistent growth/margin deterioration overrules price-zone enthusiasm.
Thesis Invalidation and Reassessment Triggers
| Trigger | What would change | Required OODA response |
|---|---|---|
| Paid subscriber growth or margin inflects down | Consecutive weakening quarters or guidance cut | Cancel buy zones; rebuild FCF/EPS |
| Normalized EPS estimate materially misses | Scenario fair values drop below target zones | Reset thresholds from revised expectations |
| Failed $500 / break $470 | Close and follow-through below swing structure | Stop adding; wait for new base |
| Broad risk-off and yield shock | Credit stress, rates or index breakdown | Raise margin of safety and cash |
Next scheduled recheck: October 22, 2026 scheduled earnings. Unscheduled recheck: Material royalty agreement, guidance cut, abrupt high-volume breakdown or cash-flow revision. Falling into a lower zone does not authorize averaging down after thesis invalidation.
OODA: Observe. Orient. Decide. Act.
Observe: $526.42 close, −24.81% off 52-week high; strong Q2 subscriber/revenue/margin progress and early-October rebound.
Orient: The business looks healthier than the drawdown implies, but forward P/E ~34.6× and an October 22 event demand selectivity.
Decide: Watch at current levels; do not chase simply because shares are below the high.
Act: Review $490–515 starter only after stabilization; $455–490 conditional accumulation; below $405 stop and reassess. Refresh model after Oct 22 results.
Confidence, Prior Changes and Decision Audit
Confidence: Moderate on business direction; low-to-moderate on exact zone values because issuer-confirmed Q2 growth and margin, published net-cash and FCF figures, and observed trend reclaim; offset by unverified MA20/ATR, illustrative normalized EPS, and imminent earnings. Classification criteria: High requires independent fundamental, valuation, technical and market agreement with adequate current evidence; Moderate means favorable but uncertain; Low means conflicting or critical missing inputs. Do not automatically assign High to a low price.
Compared with previous OBORDA analysis (if any): An October 9 draft preceded this v2 audit; all zones were recomputed using this analysis rather than inherited. Any similarity does not constitute independent verification of their attractiveness.. Previous zones are comparison only, not model inputs.
| Audit check | Evidence / calculation | PASS / CONDITIONAL / HOLD |
|---|---|---|
| Quote, 52-week range and timestamp | Oct 8 4pm EDT, $526.42; 52w $405–700.12; StockAnalysis | PASS |
| Latest company filings, earnings, guidance | Spotify Aug 4 Q2 release; cash-flow period through June 2026 | PASS |
| Technicals and dated levels | 50/200 SMA and RSI vendor data; MA20/ATR unverified | CONDITIONAL |
| Valuation math and bull/base/bear assumptions | Illustrative EPS $13/$17.20/$20 and multiples 27/34/38; arithmetic shown | CONDITIONAL |
| Zone uniqueness, continuity and anchor rationale | Continuous boundaries; partial technical anchors but judgment-based multiple levels | CONDITIONAL |
| Risk/reward and thesis invalidation | Three explicitly calculated illustrative entries; gap risk identified | CONDITIONAL |
| Markets, flows, seasonality and opportunity cost | Oct 8 index performance verified; flows and yield incomplete | CONDITIONAL |
| Source links, disclosure, SEO and privacy | Seven links, source periods, no sensitive position sizes; SEO fields populated | PASS |
Overall publication gate: CONDITIONAL: core market and company facts checked; forward scenarios and several indicators not independently validated. If HOLD, prominently mark all levels exploratory and do not publish them as actionable recommendations.
My Spotify Stock Verdict
WATCH / NO CHASE at $526.42. Confidence: Moderate business / limited exact-zone precision. Spotify is improving its subscriber scale, revenue and gross margins, but its elevated forward multiple leaves limited margin for error. The preferred action is patience into the next earnings report, with price ranges treated as research triggers—not unconditional orders.
The market has already offered a correction. It has not yet conclusively offered a bargain.
Cash is a position. Don’t buy the dip. Buy the discount.
Sources and Method
Use primary filings/issuer releases for financial statements, official macro sources for rates, and dated market data for price/volume. Link all consequential claims. State any reporting currency conversions, estimates and unavailable data separately.
- SPOT daily OHLC and Oct 8, 2026 close
- Issuer Q2 2026 operating metrics (August 4, 2026)
- Market-based valuation, technical, share and balance-sheet summary (Oct 9 snapshot)
- Cash-flow statements, TTM ended June 2026
- Spotify August 20, 2026 repurchase expansion release
- October 8, 2026 US index performance
Data snapshot: Oct 8, 2026 4pm EDT closing price; vendor data accessed October 9 EDT. US cash market closed at report time. Prices are not live unless verified at the stated time. Normalized $17.20 EPS, bull/bear scenarios, selected exit multiples and stops are illustrative; MA20 and ATR unavailable and no peer-adjusted full valuation audit. Research/publication gate: CONDITIONAL. Buy zones are conditional—not forecasts or guaranteed returns. Reassess when material earnings, valuation or market evidence changes.